 Philadelphia 76ers
2022 Team Stats (82 games)
Model Outputs
Output is shown as model rating with league rank in parentheses when available.
| Model | Output | Notes |
|---|---|---|
| Elo Elo Streaming paired-comparison rating with recency baked into sequential updates. More → | 1136 (#7) | - |
| Bradley-Terry Bradley-Terry Static logistic paired-comparison model with one team strength parameter. More → | 1087 (#6) | - |
| Bradley-Terry Recency Bradley-Terry Recency Static Bradley-Terry with exponential recency weights on newer games. More → | 1091 (#7) | HCA +32 elo |
| Margin Margin Linear team-strength model fit on point differential instead of binary wins. More → | +2.6 (#9) | HCA +1.7 |
| Margin Recency Margin Recency Margin regression with exponential recency weights on newer games. More → | +4.3 (#6) | HCA +1.7 |
| Pythagorean Pythagorean Pythagorean win expectation from raw points scored and allowed. More → | 0.569 (#9) | - |
| Adjusted Efficiency Adjusted Efficiency Opponent-adjusted efficiency model with separate offensive and defensive components. More → | 0.563 (#10) | AdjNet +2.2 |
| Log Adjusted Log Adjusted Log-scale adjusted efficiency model that downweights blowout leverage. More → | 0.563 (#10) | AdjNet +2.2 |
| Points Off/Def Points Off/Def Raw points regression with separate offensive and defensive team parameters. More → | 0.557 (#9) | AdjO 109.2 | AdjD 106.7 |
| Points Off/Def Recency Points Off/Def Recency Off/def points regression with exponential recency weights. More → | 0.590 (#7) | AdjO 113.2 | AdjD 109.2 |
| Core Ensemble Core Ensemble Equal-logit blend of Elo, recency BT, recency margin, log-adjusted pyth, and points off/def. More → | 0.611 (#7) | Blend of Elo, BT, Margin, PythLog, PtsOD |
| Recency Ensemble Recency Ensemble Equal-logit blend of Elo, recency BT, recency margin, log-adjusted pyth, and recency points off/def. More → | 0.617 (#7) | Blend of Elo, BT, Margin, PythLog, PtsOD |
| Dynamic Bradley-Terry Dynamic Bradley-Terry Time-evolving paired-comparison model with latent team strength drift. More → | 1107 (#6) | RD 87 | GP 82 |
2022 Schedule & Results
2022 Roster
Counting stats use played regular-season games. PM and RAPM use their separate model samples; PM GP shows that sample's game count.
Minutes by Position
Not enough player minute data to plot.
| Player | Pos | GP | MIN | PTS | REB | AST | STL | BLK | TO | FGA | Numbers | PM | PM GP | PM/G | PM/40 | FG% | 3P% | FT% | RAPM | TS% | eFG% |
|---|---|---|---|---|---|---|---|---|---|---|---|---|---|---|---|---|---|---|---|---|---|
 Paul Millsap |
C | - | - | - | - | - | - | - | - | - | - | 32 | 23 | 1.4 | 0.2 | - | - | - | 1.05 | - | - |
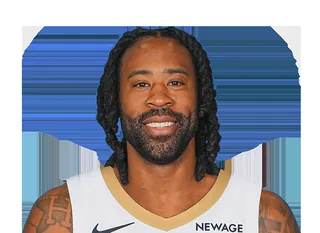 DeAndre Jordan |
C | - | - | - | - | - | - | - | - | - | - | 11 | 40 | 0.3 | 0.0 | - | - | - | -0.28 | - | - |
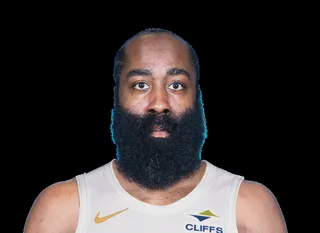 James Harden |
SG | - | - | - | - | - | - | - | - | - | - | 6 | 50 | 0.1 | 0.0 | - | - | - | 1.22 | - | - |
 Danny Green |
SG | - | - | - | - | - | - | - | - | - | - | 89 | 41 | 2.2 | 0.3 | - | - | - | 0.83 | - | - |
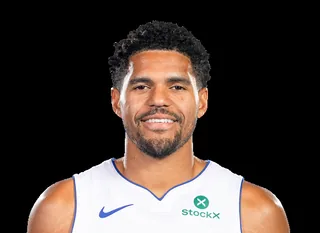 Tobias Harris |
SF | - | - | - | - | - | - | - | - | - | - | 109 | 51 | 2.1 | 0.2 | - | - | - | 1.17 | - | - |
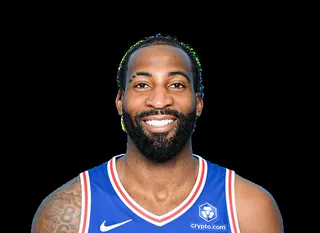 Andre Drummond |
C | - | - | - | - | - | - | - | - | - | - | -3 | 50 | -0.1 | -0.0 | - | - | - | 0.82 | - | - |
 Seth Curry |
SG | - | - | - | - | - | - | - | - | - | - | - | - | - | - | - | - | - | - | - | - |
 Joel Embiid |
C | - | - | - | - | - | - | - | - | - | - | 31 | 44 | 0.7 | 0.1 | - | - | - | -1.01 | - | - |
 Tyler Johnson |
- | - | - | - | - | - | - | - | - | - | - | -57 | 6 | -9.5 | -1.2 | - | - | - | -2.09 | - | - |
 Willie Cauley-Stein |
- | - | - | - | - | - | - | - | - | - | - | 13 | 19 | 0.7 | 0.1 | - | - | - | -0.01 | - | - |
 Ben Simmons |
- | - | - | - | - | - | - | - | - | - | - | - | - | - | - | - | - | - | - | - | - |
 Georges Niang |
SF | - | - | - | - | - | - | - | - | - | - | 102 | 52 | 2.0 | 0.2 | - | - | - | 0.4 | - | - |
 Furkan Korkmaz |
SG | - | - | - | - | - | - | - | - | - | - | 88 | 44 | 2.0 | 0.3 | - | - | - | 0.48 | - | - |
 Shake Milton |
SG | - | - | - | - | - | - | - | - | - | - | 127 | 36 | 3.5 | 0.4 | - | - | - | 1.37 | - | - |
 Myles Powell |
- | - | - | - | - | - | - | - | - | - | - | -1 | 9 | -0.1 | -0.0 | - | - | - | -0.87 | - | - |
 Charles Bassey |
- | - | - | - | - | - | - | - | - | - | - | 51 | 15 | 3.4 | 0.6 | - | - | - | 0.92 | - | - |
 Matisse Thybulle |
SG | - | - | - | - | - | - | - | - | - | - | -6 | 45 | -0.1 | -0.0 | - | - | - | -2.43 | - | - |
 Charlie Brown, Jr. |
SF | - | - | - | - | - | - | - | - | - | - | 43 | 16 | 2.7 | 0.6 | - | - | - | 0.56 | - | - |
 Tyrese Maxey |
SG | - | - | - | - | - | - | - | - | - | - | 70 | 51 | 1.4 | 0.2 | - | - | - | -0.25 | - | - |
 Paul Reed |
PF | - | - | - | - | - | - | - | - | - | - | 30 | 24 | 1.2 | 0.3 | - | - | - | -0.09 | - | - |
 Isaiah Joe |
SG | - | - | - | - | - | - | - | - | - | - | 68 | 36 | 1.9 | 0.3 | - | - | - | 0.92 | - | - |
| Grant Riller | - | - | - | - | - | - | - | - | - | - | - | - | - | - | - | - | - | - | - | - | - |
 Braxton Key |
- | - | - | - | - | - | - | - | - | - | - | 20 | 6 | 3.3 | 0.5 | - | - | - | 0.43 | - | - |
 Jaden Springer |
- | - | - | - | - | - | - | - | - | - | - | - | - | - | - | - | - | - | -0.64 | - | - |
| Aaron Henry | - | - | - | - | - | - | - | - | - | - | - | - | - | - | - | - | - | - | - | - | - |
Numbers/Game vs RAPM
Not enough players with both Numbers/Game and RAPM to plot.
Advanced: Numbers = PTS+REB+AST+STL+BLK-TO-FGA, PM = total +/-, PM/G = per game, PM/40 = per 40 minutes, RAPM = Regularized Adj Plus-Minus, TS% = True Shooting, eFG% = Effective FG
2021-2022 Shot Zones
6920 located field-goal attempts in 82 games (NBA Stats). Each zone is coloured by the player with the largest share of the team's made-shot points there (left) and of its misses there (right).
Joel EmbiidTyrese MaxeyTobias HarrisGeorges NiangSeth CurryDanny Green
| Zone | FGM-FGA | FG% | Pts | Top scorer | Runner-up | Most misses | Runner-up |
|---|---|---|---|---|---|---|---|
| Restricted area | 1293-1951 | 66.3 | 2586 | Joel Embiid 22% (572 pts) | Tobias Harris 16% (404 pts) | Tyrese Maxey 18% (117 misses) | Joel Embiid 16% (103 misses) |
| Paint (non-RA) | 547-1324 | 41.3 | 1094 | Tobias Harris 25% (276 pts) | Joel Embiid 22% (236 pts) | Joel Embiid 23% (181 misses) | Tobias Harris 23% (177 misses) |
| Mid-range left | 183-426 | 43.0 | 366 | Joel Embiid 48% (176 pts) | Tobias Harris 15% (56 pts) | Joel Embiid 48% (116 misses) | Tobias Harris 16% (40 misses) |
| Mid-range center | 108-232 | 46.6 | 216 | Joel Embiid 50% (108 pts) | Seth Curry 19% (40 pts) | Joel Embiid 44% (54 misses) | Seth Curry 14% (17 misses) |
| Mid-range right | 149-391 | 38.1 | 298 | Seth Curry 34% (100 pts) | Tyrese Maxey 24% (72 pts) | Tyrese Maxey 24% (59 misses) | Joel Embiid 23% (56 misses) |
| Left corner 3 | 124-312 | 39.7 | 372 | Georges Niang 23% (87 pts) | Danny Green 16% (60 pts) | Georges Niang 21% (39 misses) | Danny Green 18% (34 misses) |
| Right corner 3 | 146-386 | 37.8 | 438 | Danny Green 27% (117 pts) | Tyrese Maxey 16% (72 pts) | Danny Green 21% (50 misses) | Georges Niang 18% (42 misses) |
| Above-break 3 left | 242-725 | 33.4 | 726 | Georges Niang 16% (117 pts) | Joel Embiid 14% (102 pts) | Georges Niang 14% (66 misses) | Tobias Harris 13% (62 misses) |
| Above-break 3 center | 154-439 | 35.1 | 462 | Joel Embiid 22% (102 pts) | Tyrese Maxey 15% (69 pts) | Joel Embiid 22% (63 misses) | Tyrese Maxey 14% (39 misses) |
| Above-break 3 right | 284-734 | 38.7 | 852 | Georges Niang 18% (156 pts) | Seth Curry 15% (129 pts) | Tyrese Maxey 14% (61 misses) | Georges Niang 12% (54 misses) |