 Minnesota Timberwolves
2020 Team Stats (17 games)
Model Outputs
Output is shown as model rating with league rank in parentheses when available.
| Model | Output | Notes |
|---|---|---|
| Elo Elo Streaming paired-comparison rating with recency baked into sequential updates. More → | 770 (#28) | - |
| Bradley-Terry Bradley-Terry Static logistic paired-comparison model with one team strength parameter. More → | 859 (#26) | - |
| Bradley-Terry Recency Bradley-Terry Recency Static Bradley-Terry with exponential recency weights on newer games. More → | 994 (#17) | HCA +2 elo |
| Margin Margin Linear team-strength model fit on point differential instead of binary wins. More → | -3.9 (#22) | HCA +2.1 |
| Margin Recency Margin Recency Margin regression with exponential recency weights on newer games. More → | -4.6 (#25) | HCA +1.1 |
| Pythagorean Pythagorean Pythagorean win expectation from raw points scored and allowed. More → | 0.395 (#24) | - |
| Efficiency Efficiency Tempo-adjusted efficiency version of Pythagorean ratings. More → | 0.550 (#12) | NetEff +1.8 |
| Adjusted Efficiency Adjusted Efficiency Opponent-adjusted efficiency model with separate offensive and defensive components. More → | 0.409 (#22) | AdjNet -3.2 |
| Log Adjusted Log Adjusted Log-scale adjusted efficiency model that downweights blowout leverage. More → | 0.409 (#22) | AdjNet -3.2 |
| Points Off/Def Points Off/Def Raw points regression with separate offensive and defensive team parameters. More → | 0.414 (#22) | AdjO 112.2 | AdjD 116.0 |
| Points Off/Def Recency Points Off/Def Recency Off/def points regression with exponential recency weights. More → | 0.483 (#21) | AdjO 112.9 | AdjD 113.7 |
| Core Ensemble Core Ensemble Equal-logit blend of Elo, recency BT, recency margin, log-adjusted pyth, and points off/def. More → | 0.373 (#24) | Blend of Elo, BT, Margin, PythLog, PtsOD |
| Recency Ensemble Recency Ensemble Equal-logit blend of Elo, recency BT, recency margin, log-adjusted pyth, and recency points off/def. More → | 0.386 (#24) | Blend of Elo, BT, Margin, PythLog, PtsOD |
| Dynamic Bradley-Terry Dynamic Bradley-Terry Time-evolving paired-comparison model with latent team strength drift. More → | 894 (#24) | RD 350 | GP 64 |
2020 Schedule & Results
| Date | Vs/At | Opponent | Result | Score |
|---|---|---|---|---|
| 2019-10-23 | @ | Brooklyn Nets | - | Incomplete score |
| 2019-10-25 | @ | Charlotte Hornets | - | Incomplete score |
| 2019-10-27 | vs | Miami Heat | - | Incomplete score |
| 2019-10-30 | @ | Philadelphia 76ers | - | Incomplete score |
| 2019-11-03 | @ | Washington Wizards | - | Incomplete score |
| 2019-11-05 | vs | Milwaukee Bucks | - | Incomplete score |
| 2019-11-07 | @ | Memphis Grizzlies | - | Incomplete score |
| 2019-11-09 | vs | Golden State Warriors | - | Incomplete score |
| 2019-11-10 | vs | Denver Nuggets | - | Incomplete score |
| 2019-11-12 | @ | Detroit Pistons | - | Incomplete score |
| 2019-11-14 | vs | San Antonio Spurs | - | Incomplete score |
| 2019-11-16 | vs | Washington Wizards | - | Incomplete score |
| 2019-11-17 | vs | Houston Rockets | - | Incomplete score |
| 2019-11-19 | @ | Utah Jazz | - | Incomplete score |
| 2019-11-21 | vs | Utah Jazz | - | Incomplete score |
| 2019-11-23 | vs | Phoenix Suns | - | Incomplete score |
| 2019-11-26 | @ | Atlanta Hawks | - | Incomplete score |
| 2019-11-28 | @ | San Antonio Spurs | - | Incomplete score |
| 2019-12-01 | vs | Memphis Grizzlies | - | Incomplete score |
| 2019-12-04 | @ | Dallas Mavericks | L | 114 - 121 |
| 2019-12-06 | @ | Oklahoma City Thunder | L | 127 - 139 |
| 2019-12-09 | @ | Los Angeles Lakers | - | Incomplete score |
| 2019-12-10 | @ | Phoenix Suns | - | Incomplete score |
| 2019-12-12 | vs | Utah Jazz | - | Incomplete score |
| 2019-12-14 | vs | LA Clippers | - | Incomplete score |
| 2019-12-19 | vs | New Orleans Pelicans | - | Incomplete score |
| 2019-12-21 | @ | Denver Nuggets | - | Incomplete score |
| 2019-12-22 | @ | Portland Trail Blazers | - | Incomplete score |
| 2019-12-24 | @ | Golden State Warriors | - | Incomplete score |
| 2019-12-27 | @ | Sacramento Kings | - | Incomplete score |
| 2019-12-29 | vs | Cleveland Cavaliers | - | Incomplete score |
| 2019-12-31 | vs | Brooklyn Nets | - | Incomplete score |
| 2020-01-02 | @ | Milwaukee Bucks | - | Incomplete score |
| 2020-01-03 | vs | Golden State Warriors | - | Incomplete score |
| 2020-01-06 | @ | Cleveland Cavaliers | - | Incomplete score |
| 2020-01-08 | @ | Memphis Grizzlies | - | Incomplete score |
| 2020-01-10 | vs | Portland Trail Blazers | - | Incomplete score |
| 2020-01-11 | @ | Houston Rockets | - | Incomplete score |
| 2020-01-14 | vs | Oklahoma City Thunder | - | Incomplete score |
| 2020-01-16 | vs | Indiana Pacers | - | Incomplete score |
| 2020-01-17 | @ | Indiana Pacers | L | 114 - 116 |
| 2020-01-19 | vs | Toronto Raptors | - | Incomplete score |
| 2020-01-21 | vs | Denver Nuggets | - | Incomplete score |
| 2020-01-23 | @ | Chicago Bulls | - | Incomplete score |
| 2020-01-24 | vs | Houston Rockets | L | 124 - 131 |
| 2020-01-25 | vs | Oklahoma City Thunder | L | 104 - 113 |
| 2020-01-27 | vs | Sacramento Kings | L | 129 - 133 |
| 2020-02-01 | @ | LA Clippers | L | 106 - 118 |
| 2020-02-03 | @ | Sacramento Kings | L | 109 - 113 |
| 2020-02-05 | vs | Atlanta Hawks | L | 120 - 127 |
| 2020-02-08 | vs | LA Clippers | W | 142 - 115 |
| 2020-02-10 | @ | Toronto Raptors | L | 126 - 137 |
| 2020-02-12 | vs | Charlotte Hornets | L | 108 - 115 |
| 2020-02-21 | vs | Boston Celtics | L | 117 - 127 |
| 2020-02-23 | @ | Denver Nuggets | - | Incomplete score |
| 2020-02-24 | @ | Dallas Mavericks | L | 123 - 139 |
| 2020-02-27 | @ | Miami Heat | - | Incomplete score |
| 2020-02-29 | @ | Orlando Magic | - | Incomplete score |
| 2020-03-01 | vs | Dallas Mavericks | - | Incomplete score |
| 2020-03-03 | @ | New Orleans Pelicans | W | 139 - 134 |
| 2020-03-05 | vs | Chicago Bulls | - | Incomplete score |
| 2020-03-06 | vs | Orlando Magic | L | 118 - 132 |
| 2020-03-08 | vs | New Orleans Pelicans | L | 107 - 120 |
| 2020-03-11 | @ | Houston Rockets | - | Incomplete score |
2020 Roster
Counting stats use played regular-season games. PM and RAPM use their separate model samples; PM GP shows that sample's game count.
Minutes by Position
The surface stays filled across the five on-court roles. Use the labels or legend to isolate how each player absorbs guard-to-big minutes.
| Player | Pos | GP | MIN | PTS | REB | AST | STL | BLK | TO | FGA | Numbers | PM | PM GP | PM/G | PM/40 | FG% | 3P% | FT% | RAPM | TS% | eFG% |
|---|---|---|---|---|---|---|---|---|---|---|---|---|---|---|---|---|---|---|---|---|---|
 Karl-Anthony Towns |
C | 11 | 35.3 | 26.6 | 9.4 | 4.9 | 1.0 | 1.3 | - | 18.2 | - | - | - | - | - | 50.5 | 44.0 | 78.4 | - | 63.0 | 58.8 |
 Malik Beasley |
G | 8 | 33.2 | 24.0 | 5.5 | 2.0 | 0.4 | 0.1 | - | 18.5 | - | - | - | - | - | 50.7 | 45.7 | 66.7 | - | 62.1 | 61.5 |
 Andrew Wiggins |
G | 8 | 34.2 | 22.8 | 5.2 | 3.5 | 0.6 | 0.8 | - | 17.6 | - | -20 | 27 | -0.7 | -47.1 | 45.4 | 42.6 | 68.9 | 0.75 | 56.6 | 53.5 |
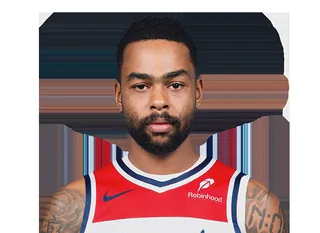 D'Angelo Russell |
G | 7 | 31.7 | 20.3 | 4.1 | 7.1 | 0.9 | 0.3 | - | 17.7 | - | - | - | - | - | 37.9 | 27.8 | 94.3 | - | 50.9 | 44.0 |
 Jeff Teague |
G | 2 | 34.0 | 17.5 | 3.0 | 7.5 | 1.0 | 0.0 | - | 11.0 | - | -45 | 33 | -1.4 | -180.0 | 54.5 | 57.1 | 100.0 | -0.36 | 69.8 | 63.6 |
 Robert Covington |
F | 8 | 32.4 | 14.6 | 6.9 | 1.2 | 1.2 | 0.8 | - | 11.4 | - | -24 | 35 | -0.7 | -56.5 | 46.2 | 38.3 | 83.3 | 0.75 | 60.8 | 58.8 |
| James Johnson | C | 8 | 23.8 | 12.4 | 4.9 | 3.9 | 1.2 | 1.6 | - | 9.0 | - | - | - | - | - | 47.2 | 44.8 | 72.0 | - | 59.6 | 56.2 |
 Juancho Hernangomez |
F | 8 | 29.2 | 12.1 | 6.4 | 1.1 | 1.0 | 0.2 | - | 9.4 | - | - | - | - | - | 42.7 | 39.4 | 62.5 | - | 54.4 | 51.3 |
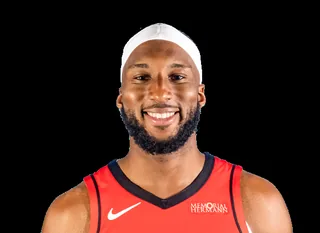 Josh Okogie |
G | 17 | 27.2 | 10.9 | 4.2 | 1.2 | 1.3 | 0.1 | - | 7.1 | - | - | - | - | - | 49.2 | 30.8 | 86.2 | - | 62.6 | 54.2 |
| Shabazz Napier | G | 8 | 25.8 | 10.5 | 4.1 | 6.6 | 1.1 | 0.1 | - | 7.5 | - | - | - | - | - | 46.7 | 35.5 | 81.0 | - | 60.7 | 55.8 |
 Naz Reid |
C | 12 | 17.4 | 9.2 | 4.8 | 1.1 | 1.0 | 0.9 | - | 8.2 | - | - | - | - | - | 39.4 | 35.3 | 90.9 | - | 50.6 | 45.5 |
 Jordan McLaughlin |
G | 15 | 20.6 | 9.1 | 1.6 | 4.5 | 1.1 | 0.3 | - | 6.5 | - | - | - | - | - | 56.1 | 47.5 | 72.7 | - | 66.6 | 65.8 |
 Jake Layman |
- | 4 | 15.9 | 8.0 | 1.5 | 0.2 | 0.5 | 0.0 | - | 5.8 | - | - | - | - | - | 47.8 | 22.2 | 80.0 | - | 58.4 | 52.2 |
 Jarrett Culver |
G | 17 | 23.7 | 7.7 | 3.1 | 1.3 | 0.9 | 0.5 | - | 7.6 | - | - | - | - | - | 39.2 | 22.6 | 56.7 | - | 45.7 | 43.8 |
| Kelan Martin | F | 10 | 12.6 | 5.2 | 2.7 | 1.1 | 0.3 | 0.3 | - | 3.6 | - | - | - | - | - | 47.2 | 21.1 | 100.0 | - | 61.7 | 52.8 |
| Treveon Graham | - | 2 | 13.0 | 4.5 | 2.0 | 0.5 | 1.0 | 0.0 | - | 4.0 | - | - | - | - | - | 50.0 | 25.0 | 0 | - | 56.2 | 56.2 |
 Jordan Bell |
- | 4 | 10.0 | 4.5 | 2.0 | 0.5 | 0.0 | 0.5 | - | 3.0 | - | - | - | - | - | 58.3 | 0.0 | 50.0 | - | 58.0 | 58.3 |
 Keita Bates-Diop |
- | 8 | 16.7 | 4.4 | 2.4 | 1.5 | 0.2 | 0.6 | - | 4.6 | - | 17 | 20 | 0.8 | 56.7 | 37.8 | 17.6 | 100.0 | 0.04 | 45.1 | 41.9 |
 Jaylen Nowell |
- | 5 | 9.4 | 4.0 | 0.8 | 2.0 | 0.6 | 0.0 | - | 2.8 | - | - | - | - | - | 42.9 | 25.0 | 100.0 | - | 58.5 | 46.4 |
 Gorgui Dieng |
- | 9 | 11.2 | 3.7 | 3.0 | 0.8 | 0.2 | 0.4 | - | 3.3 | - | -42 | 28 | -1.5 | -168.0 | 43.3 | 33.3 | 66.7 | -0.36 | 52.7 | 51.7 |
| Allen Crabbe | - | 7 | 13.4 | 3.0 | 1.3 | 0.3 | 0.0 | 0.0 | - | 3.3 | - | - | - | - | - | 34.8 | 22.2 | 50.0 | - | 44.0 | 43.5 |
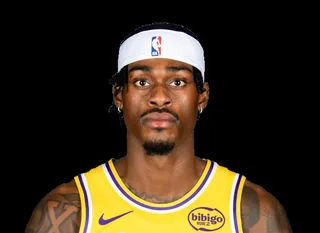 Jarred Vanderbilt |
- | 2 | 2.5 | 1.0 | 0.5 | 0.0 | 0.0 | 0.0 | - | 0.5 | - | - | - | - | - | 0.0 | 0.0 | 100.0 | - | 53.2 | 0.0 |
 Noah Vonleh |
- | 1 | 0.0 | 0.0 | 0.0 | 0.0 | 0.0 | 0.0 | - | 0.0 | - | 70 | 24 | 2.9 | 164.7 | 0 | 0 | 0 | 0.77 | 0 | 0 |
| Jacob Evans | - | 2 | 2.1 | 0.0 | 0.0 | 0.0 | 0.0 | 0.0 | - | 0.5 | - | - | - | - | - | 0.0 | 0.0 | 0 | - | 0.0 | 0.0 |
Numbers/Game vs RAPM
Not enough players with both Numbers/Game and RAPM to plot.
Advanced: Numbers = PTS+REB+AST+STL+BLK-TO-FGA, PM = total +/-, PM/G = per game, PM/40 = per 40 minutes, RAPM = Regularized Adj Plus-Minus, TS% = True Shooting, eFG% = Effective FG
2019-2020 Shot Zones
5854 located field-goal attempts in 64 games (NBA Stats). Each zone is coloured by the player with the largest share of the team's made-shot points there (left) and of its misses there (right).
Andrew WigginsKarl-Anthony TownsRobert CovingtonJarrett CulverJosh OkogieD'Angelo Russell
| Zone | FGM-FGA | FG% | Pts | Top scorer | Runner-up | Most misses | Runner-up |
|---|---|---|---|---|---|---|---|
| Restricted area | 1268-2039 | 62.2 | 2536 | Andrew Wiggins 13% (326 pts) | Karl-Anthony Towns 12% (316 pts) | Jarrett Culver 15% (116 misses) | Andrew Wiggins 10% (78 misses) |
| Paint (non-RA) | 303-864 | 35.1 | 606 | Andrew Wiggins 20% (122 pts) | Jeff Teague 15% (92 pts) | Andrew Wiggins 19% (108 misses) | Jeff Teague 11% (62 misses) |
| Mid-range left | 64-183 | 35.0 | 128 | Andrew Wiggins 22% (28 pts) | Karl-Anthony Towns 16% (20 pts) | Andrew Wiggins 21% (25 misses) | Karl-Anthony Towns 18% (22 misses) |
| Mid-range center | 37-92 | 40.2 | 74 | D'Angelo Russell 30% (22 pts) | Andrew Wiggins 24% (18 pts) | Andrew Wiggins 36% (20 misses) | D'Angelo Russell 15% (8 misses) |
| Mid-range right | 61-147 | 41.5 | 122 | Andrew Wiggins 21% (26 pts) | Malik Beasley 13% (16 pts) | Andrew Wiggins 28% (24 misses) | Gorgui Dieng 15% (13 misses) |
| Left corner 3 | 84-249 | 33.7 | 252 | Andrew Wiggins 11% (27 pts) | Keita Bates-Diop 11% (27 pts) | Robert Covington 9% (15 misses) | Andrew Wiggins 8% (14 misses) |
| Right corner 3 | 69-209 | 33.0 | 207 | Josh Okogie 12% (24 pts) | Gorgui Dieng 10% (21 pts) | Josh Okogie 14% (20 misses) | Jarrett Culver 14% (19 misses) |
| Above-break 3 left | 268-786 | 34.1 | 804 | Karl-Anthony Towns 14% (111 pts) | Andrew Wiggins 13% (105 pts) | Andrew Wiggins 16% (82 misses) | Robert Covington 12% (61 misses) |
| Above-break 3 center | 221-664 | 33.3 | 663 | Karl-Anthony Towns 21% (141 pts) | Robert Covington 15% (99 pts) | Karl-Anthony Towns 16% (73 misses) | Robert Covington 14% (63 misses) |
| Above-break 3 right | 210-621 | 33.8 | 630 | Robert Covington 19% (120 pts) | Andrew Wiggins 12% (75 pts) | Robert Covington 14% (56 misses) | Jarrett Culver 12% (49 misses) |