 Northern Colorado
2026-2027 Team Stats (2 games)
Model Outputs
Output is shown as model rating with league rank in parentheses when available.
| Model | Output | Notes |
|---|---|---|
| Elo Elo Streaming paired-comparison rating with recency baked into sequential updates. More → | 884 (#202) | Preseason prior 890 (returning production + recruiting): last season 990, returning -42, transfers -32, freshmen -27 |
| Bradley-Terry Bradley-Terry Static logistic paired-comparison model with one team strength parameter. More → | 941 (#210) | HCA +224 elo |
| Bradley-Terry Recency Bradley-Terry Recency Static Bradley-Terry with exponential recency weights on newer games. More → | 968 (#214) | HCA +223 elo |
| Margin Margin Linear team-strength model fit on point differential instead of binary wins. More → | -10.7 (#305) | HCA +1.7 |
| Margin Recency Margin Recency Margin regression with exponential recency weights on newer games. More → | -10.6 (#305) | HCA +1.7 |
| Pythagorean Pythagorean Pythagorean win expectation from raw points scored and allowed. More → | 0.233 (#279) | - |
| Adjusted Efficiency Adjusted Efficiency Opponent-adjusted efficiency model with separate offensive and defensive components. More → | 0.381 (#254) | AdjNet -12.2 |
| Log Adjusted Log Adjusted Log-scale adjusted efficiency model that downweights blowout leverage. More → | 0.380 (#254) | AdjNet -12.1 |
| Points Off/Def Points Off/Def Raw points regression with separate offensive and defensive team parameters. More → | 0.394 (#255) | AdjO 68.3 | AdjD 74.9 |
| Points Off/Def Recency Points Off/Def Recency Off/def points regression with exponential recency weights. More → | 0.414 (#262) | AdjO 68.3 | AdjD 74.9 |
| Core Ensemble Core Ensemble Equal-logit blend of Elo, recency BT, recency margin, log-adjusted pyth, and points off/def. More → | 0.356 (#263) | Blend of Elo, BT, Margin, PythLog, PtsOD |
| Recency Ensemble Recency Ensemble Equal-logit blend of Elo, recency BT, recency margin, log-adjusted pyth, and recency points off/def. More → | 0.360 (#265) | Blend of Elo, BT, Margin, PythLog, PtsOD |
| Dynamic Bradley-Terry Dynamic Bradley-Terry Time-evolving paired-comparison model with latent team strength drift. More → | 929 (#213) | RD 218 | GP 1 |
| Adjusted Context Blend Adjusted Context Blend Chronologically trained component blend with rest and signed venue context. More → | 0.356 (#226) | Chronological component blend with rest and venue. |
2026-2027 Schedule & Results
| Date | Vs/At | Opponent | Result | Score |
|---|---|---|---|---|
| 2026-11-02 | vs | Colorado College Tigers | W | 117 - 64 |
| 2026-11-06 | @ | Arizona State Sun Devils | L | 63 - 90 |
| 2026-11-10 | vs | Northern New Mexico Eagles | - | Preview |
| 2026-11-14 | vs | South Dakota State Jackrabbits | - | Preview |
2026-2027 Roster
Estimated Minutes by Position
Estimated from roster positions, box scores and minutes played. Each column totals one game's minutes, divided among the players. Use the labels or legend to highlight a player's estimated role.
| Player | Pos | GP | MIN | PTS | REB | AST | STL | BLK | TO | FGA | Numbers | PM | PM GP | PM/G | PM/40 | FG% | 3P% | FT% | RAPM | TS% | eFG% |
|---|---|---|---|---|---|---|---|---|---|---|---|---|---|---|---|---|---|---|---|---|---|
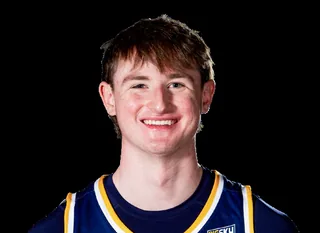 Hunter Caldwell |
C | 2 | 23.0 | 11.5 | 3.0 | 0.5 | 0.0 | 1.5 | 0.5 | 9.0 | 7.0 | 7 | 2 | 3.5 | 6.1 | 38.9 | 50.0 | 100.0 | -0.08 | 60.9 | 58.3 |
 Manning Shareef |
F | 2 | 20.5 | 11.5 | 5.0 | 2.0 | 0.5 | 0.5 | 1.5 | 5.5 | 12.5 | 0 | 2 | 0.0 | 0.0 | 63.6 | 50.0 | 87.5 | -0.39 | 79.2 | 72.7 |
 Andrew Crawford |
F | 2 | 25.5 | 9.5 | 5.0 | 2.0 | 0.0 | 0.0 | 2.5 | 6.5 | 7.5 | 6 | 2 | 3.0 | 4.7 | 53.8 | 50.0 | 50.0 | 0.03 | 60.7 | 61.5 |
 Jeremiah Hammond |
G | 2 | 15.5 | 9.5 | 1.0 | 0.0 | 1.5 | 0.5 | 0.5 | 5.5 | 6.5 | 10 | 2 | 5.0 | 13.0 | 54.5 | 60.0 | 80.0 | 0.24 | 72.0 | 68.2 |
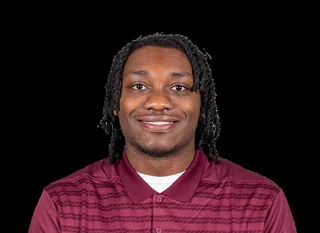 Langston Reynolds |
G | 2 | 29.0 | 8.5 | 4.0 | 5.0 | 0.5 | 0.0 | 2.5 | 9.0 | 6.5 | 18 | 2 | 9.0 | 12.5 | 44.4 | 0 | 33.3 | 0.75 | 44.0 | 44.4 |
 Tanner Braketa |
G | 1 | 8.0 | 8.0 | 1.0 | 4.0 | 0.0 | 0.0 | 0.0 | 2.0 | 11.0 | 1 | 1 | 1.0 | 9.2 | 50.0 | 50.0 | 83.3 | -0.1 | 86.2 | 75.0 |
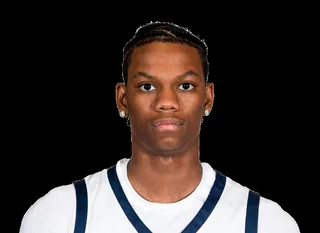 Kaidon Rayfield |
F | 2 | 20.5 | 8.0 | 4.5 | 0.5 | 0.0 | 0.5 | 1.5 | 5.5 | 6.5 | 1 | 2 | 0.5 | 1.0 | 54.5 | 60.0 | 16.7 | -0.88 | 58.7 | 68.2 |
 Chiante Tramble |
G | 2 | 13.0 | 6.5 | 1.5 | 3.0 | 0.0 | 0.0 | 0.5 | 5.0 | 5.5 | 8 | 2 | 4.0 | 12.0 | 50.0 | 33.3 | 66.7 | -0.17 | 57.4 | 55.0 |
 Campbell Blogg |
G | 2 | 8.0 | 5.5 | 2.0 | 2.0 | 0.0 | 0.0 | 0.5 | 2.5 | 6.5 | 3 | 2 | 1.5 | 7.4 | 60.0 | 50.0 | 66.7 | -0.16 | 72.0 | 70.0 |
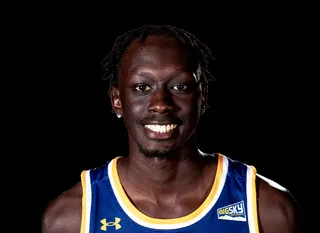 Ariik Mawien |
G | 2 | 4.5 | 5.5 | 0.5 | 0.0 | 0.0 | 0.5 | 0.5 | 2.5 | 3.5 | 2 | 1 | 2.0 | 14.2 | 80.0 | 100.0 | 50.0 | 0.71 | 81.4 | 90.0 |
 Vincent Delano |
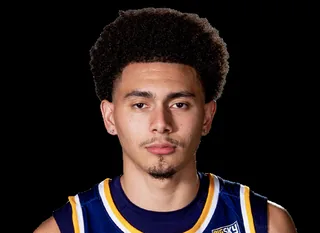
G | 2 | 21.5 | 5.0 | 1.5 | 2.5 | 0.0 | 0.0 | 1.5 | 5.5 | 2.0 | 12 | 2 | 6.0 | 11.3 | 36.4 | 25.0 | 100.0 | -1.0 | 43.7 | 40.9 |
 Will Gordon |
G | 1 | 3.0 | 3.0 | 1.0 | 0.0 | 0.0 | 0.0 | 0.0 | 1.0 | 3.0 | - | - | - | - | 100.0 | 100.0 | 0 | - | 150.0 | 150.0 |
 Steven Ramirez Jr. |
G | 2 | 9.0 | 2.5 | 1.0 | 0.0 | 0.0 | 0.0 | 0.0 | 1.5 | 2.0 | 15 | 1 | 15.0 | 39.7 | 33.3 | 33.3 | 100.0 | 0.36 | 64.4 | 50.0 |
 Drew Paine |
F | 1 | 9.0 | 2.0 | 4.0 | 0.0 | 1.0 | 0.0 | 0.0 | 2.0 | 5.0 | 2 | 1 | 2.0 | 14.2 | 50.0 | 0 | 0 | -0.07 | 50.0 | 50.0 |
 Egan Shields |
C | 0 | - | 0.0 | 0.0 | 0.0 | - | - | - | - | - | - | - | - | - | - | - | - | - | - | - |
Numbers/Game vs RAPM
X-axis = Numbers/Game (PTS+REB+AST+STL+BLK-TO-FGA), Y-axis = RAPM.
Advanced: Numbers = PTS+REB+AST+STL+BLK-TO-FGA, PM = total +/-, PM/G = per game, PM/40 = per 40 minutes, RAPM = Regularized Adj Plus-Minus, TS% = True Shooting, eFG% = Effective FG
Alumni in the Pros
Former Northern Colorado players in NBA 2026-2027, G League 2026-2027, matched by provider player ids (ESPN athlete ids, ESPN bios, linked StatsNBA/EuroLeague ids). Only games after their last Northern Colorado game count. These are observed results, not certified complete seasons. League and team are where each player last played a regular-season or playoff game (NBA ahead of G League when he played in both); recent games include the preseason.
Active alumni
| Player | At School | League | Team | GP | MPG | PPG | RPG | APG | Last game | Last 30 days |
|---|---|---|---|---|---|---|---|---|---|---|
| Dalton Knecht | 2021-23 | NBA | New York Knicks | 2 | 10.9 | 5.0 | 3.5 | 0.5 | 11-07 0 pts, 0 reb, 0 ast | 2 GP, 5.0 PPG, 3.5 RPG, 0.5 APG |
| Saint Thomas | 2023-24 | G League | Delaware Blue Coats | 0 | - | - | - | - | 11-07 39 pts, 10 reb, 5 ast Play-In | 1 GP, 39.0 PPG, 10.0 RPG, 5.0 APG |
Alumni around the leagues: recent games
| Date | Player | League | Team | Opponent | MIN | PTS | REB | AST | Box |
|---|---|---|---|---|---|---|---|---|---|
| 2026-11-07 | Saint Thomas | G League Play-In | Delaware Blue Coats | vs Capital City Go-Go | 33 | 39 | 10 | 5 | Box |
| 2026-11-07 | Dalton Knecht | NBA | New York Knicks | @ Cleveland Cavaliers | 5 | 0 | 0 | 0 | Box |
| 2026-11-04 | Dalton Knecht | NBA | New York Knicks | vs Chicago Bulls | 16 | 10 | 7 | 1 | Box |
| 2026-10-16 | Dalton Knecht | NBA Preseason | Los Angeles Lakers | vs Denver Nuggets | 8 | 0 | 1 | 1 | Box |
| 2026-10-10 | Saint Thomas | NBA Preseason | Philadelphia 76ers | @ Boston Celtics | 15 | 6 | 2 | 2 | Box |
| 2026-10-08 | Saint Thomas | NBA Preseason | Philadelphia 76ers | @ Brooklyn Nets | 5 | 4 | 1 | 1 | Box |
2026-2027 Shot Zones
121 located field-goal attempts in 2 games (ESPN). Each zone is coloured by the player with the largest share of the team's made-shot points there (left) and of its misses there (right).
Hunter CaldwellAndrew CrawfordLangston ReynoldsManning ShareefKaidon RayfieldChiante TrambleVincent Delano
| Zone | FGM-FGA | FG% | Pts | Top scorer | Runner-up | Most misses | Runner-up |
|---|---|---|---|---|---|---|---|
| Restricted area | 12-21 | 57.1 | 24 | Manning Shareef 33% (8 pts) | Andrew Crawford 17% (4 pts) | Langston Reynolds 44% (4 misses) | Andrew Crawford 22% (2 misses) |
| Paint (non-RA) | 25-47 | 53.2 | 50 | Langston Reynolds 24% (12 pts) | Chiante Tramble 16% (8 pts) | Langston Reynolds 27% (6 misses) | Hunter Caldwell 14% (3 misses) |
| Mid-range left | 0-3 | 0.0 | 0 | - | - | Chiante Tramble 33% (1 misses) | Hunter Caldwell 33% (1 misses) |
| Mid-range center | 0-1 | 0.0 | 0 | - | - | Vincent Delano 100% (1 misses) | - |
| Mid-range right | 0-1 | 0.0 | 0 | - | - | Manning Shareef 100% (1 misses) | - |
| Left corner 3 | 3-5 | 60.0 | 9 | Hunter Caldwell 67% (6 pts) | Jeremiah Hammond 33% (3 pts) | Hunter Caldwell 50% (1 misses) | Tanner Braketa 50% (1 misses) |
| Right corner 3 | 6-10 | 60.0 | 18 | Hunter Caldwell 33% (6 pts) | Andrew Crawford 17% (3 pts) | Andrew Crawford 25% (1 misses) | Hunter Caldwell 25% (1 misses) |
| Above-break 3 left | 6-15 | 40.0 | 18 | Hunter Caldwell 33% (6 pts) | Andrew Crawford 17% (3 pts) | Hunter Caldwell 22% (2 misses) | Vincent Delano 22% (2 misses) |
| Above-break 3 center | 4-5 | 80.0 | 12 | Manning Shareef 50% (6 pts) | Chiante Tramble 25% (3 pts) | Hunter Caldwell 100% (1 misses) | - |
| Above-break 3 right | 5-13 | 38.5 | 15 | Kaidon Rayfield 40% (6 pts) | Ariik Mawien 20% (3 pts) | Chiante Tramble 25% (2 misses) | Hunter Caldwell 25% (2 misses) |