 Indiana State
2026 Team Stats (32 games)
Model Outputs
Output is shown as model rating with league rank in parentheses when available.
| Model | Output | Notes |
|---|---|---|
| Elo Elo Streaming paired-comparison rating with recency baked into sequential updates. More → | 900 (#228) | - |
| Bradley-Terry Bradley-Terry Static logistic paired-comparison model with one team strength parameter. More → | 872 (#276) | - |
| Bradley-Terry Recency Bradley-Terry Recency Static Bradley-Terry with exponential recency weights on newer games. More → | 895 (#336) | HCA +75 elo |
| Margin Margin Linear team-strength model fit on point differential instead of binary wins. More → | -2.1 (#196) | HCA +2.3 |
| Margin Recency Margin Recency Margin regression with exponential recency weights on newer games. More → | -2.1 (#211) | HCA +2.2 |
| Pythagorean Pythagorean Pythagorean win expectation from raw points scored and allowed. More → | 0.370 (#251) | - |
| Efficiency Efficiency Tempo-adjusted efficiency version of Pythagorean ratings. More → | 0.370 (#251) | NetEff -4.9 |
| Adjusted Efficiency Adjusted Efficiency Opponent-adjusted efficiency model with separate offensive and defensive components. More → | 0.440 (#185) | AdjNet -2.1 |
| Log Adjusted Log Adjusted Log-scale adjusted efficiency model that downweights blowout leverage. More → | 0.441 (#185) | AdjNet -2.1 |
| Points Off/Def Points Off/Def Raw points regression with separate offensive and defensive team parameters. More → | 0.453 (#201) | AdjO 72.7 | AdjD 74.7 |
| Points Off/Def Recency Points Off/Def Recency Off/def points regression with exponential recency weights. More → | 0.440 (#241) | AdjO 70.5 | AdjD 73.2 |
| Core Ensemble Core Ensemble Equal-logit blend of Elo, recency BT, recency margin, log-adjusted pyth, and points off/def. More → | 0.388 (#234) | Blend of Elo, BT, Margin, PythLog, PtsOD |
| Recency Ensemble Recency Ensemble Equal-logit blend of Elo, recency BT, recency margin, log-adjusted pyth, and recency points off/def. More → | 0.386 (#248) | Blend of Elo, BT, Margin, PythLog, PtsOD |
| Dynamic Bradley-Terry Dynamic Bradley-Terry Time-evolving paired-comparison model with latent team strength drift. More → | 860 (#282) | RD 156 | GP 30 |
2026 Schedule & Results
2026 Roster
Minutes by Position
The surface stays filled across the five on-court roles. Use the labels or legend to isolate how each player absorbs guard-to-big minutes.
| Player | Pos | GP | MIN | PTS | REB | AST | STL | BLK | TO | FGA | Numbers | PM | PM GP | PM/G | PM/40 | FG% | 3P% | FT% | RAPM | TS% | eFG% |
|---|---|---|---|---|---|---|---|---|---|---|---|---|---|---|---|---|---|---|---|---|---|
 Ian Scott |
- | 32 | 30.0 | 13.5 | 6.5 | 2.6 | 1.2 | 1.0 | 2.1 | 8.2 | 14.5 | - | - | - | - | 63.2 | 38.8 | 72.4 | -2.11 | 69.4 | 66.9 |
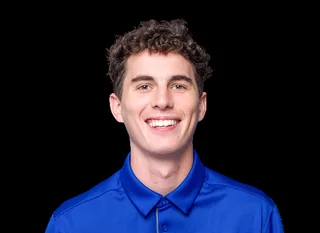 Camp Wagner |
G | 32 | 28.8 | 11.9 | 4.4 | 1.9 | 0.8 | 0.2 | 1.7 | 10.7 | 6.8 | - | - | - | - | 37.5 | 34.3 | 91.5 | -0.24 | 52.5 | 49.4 |
 Sterling Young |
G | 30 | 23.4 | 10.0 | 1.5 | 1.8 | 0.7 | 0.0 | 1.6 | 9.0 | 3.5 | - | - | - | - | 39.8 | 34.3 | 86.4 | -1.61 | 52.0 | 48.7 |
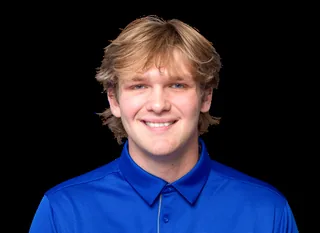 Derek Vorst |
C | 22 | 20.4 | 7.9 | 3.9 | 1.3 | 0.4 | 0.5 | 0.9 | 5.0 | 8.0 | - | - | - | - | 55.5 | 42.1 | 53.8 | 0.07 | 59.6 | 59.1 |
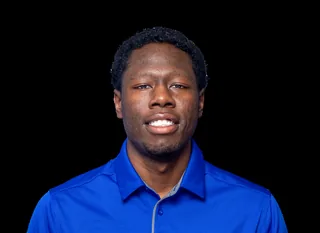 Xavier Hall |
- | 32 | 27.7 | 7.6 | 2.1 | 4.2 | 0.7 | 0.0 | 1.7 | 6.5 | 6.4 | - | - | - | - | 43.1 | 23.6 | 75.0 | -2.26 | 52.0 | 48.1 |
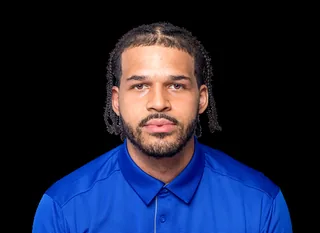 Markus Harding |
C | 22 | 20.4 | 7.3 | 3.5 | 0.8 | 0.4 | 0.5 | 2.0 | 6.0 | 4.3 | - | - | - | - | 50.8 | 34.1 | 52.4 | -1.67 | 56.6 | 56.4 |
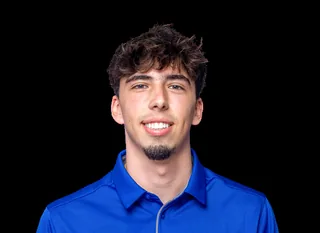 Bruno Alocen |
G | 32 | 21.2 | 6.3 | 2.9 | 1.5 | 0.6 | 0.1 | 1.1 | 5.2 | 5.1 | - | - | - | - | 37.5 | 30.3 | 80.0 | -1.38 | 53.4 | 48.5 |
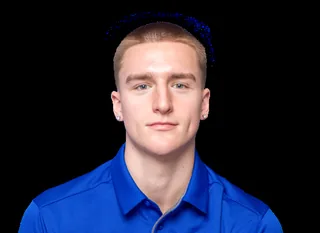 Jo Van Buggenhout |
- | 26 | 20.8 | 6.3 | 2.1 | 3.1 | 0.6 | 0.0 | 1.5 | 5.8 | 4.7 | - | - | - | - | 40.1 | 28.7 | 64.3 | -0.38 | 49.6 | 47.7 |
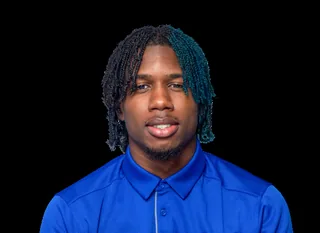 Enel St. Bernard |
- | 31 | 18.2 | 5.9 | 5.5 | 0.9 | 0.8 | 1.0 | 0.9 | 3.8 | 9.5 | - | - | - | - | 66.9 | 0.0 | 39.4 | - | 62.6 | 66.9 |
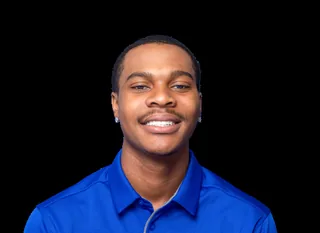 Jayan Walker |
G | 11 | 7.1 | 2.5 | 1.5 | 0.5 | 0.5 | 0.0 | 0.8 | 2.0 | 2.2 | - | - | - | - | 45.5 | 27.3 | 80.0 | - | 55.8 | 52.3 |
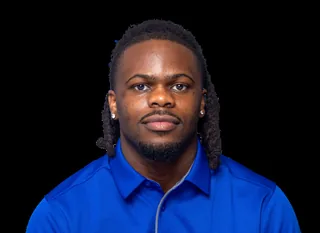 Zyair Greene |
- | 4 | 7.2 | 2.0 | 0.8 | 0.0 | 0.0 | 0.0 | 0.0 | 2.5 | 0.2 | - | - | - | - | 30.0 | 12.5 | 50.0 | - | 36.8 | 35.0 |
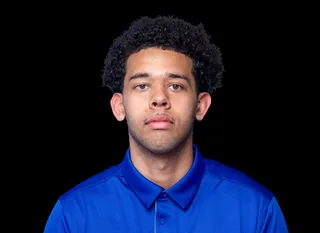 Hunter Harding |
- | 13 | 7.2 | 1.8 | 1.2 | 0.5 | 0.3 | 0.2 | 0.5 | 1.0 | 2.5 | - | - | - | - | 76.9 | 60.0 | 33.3 | -0.82 | 83.8 | 88.5 |
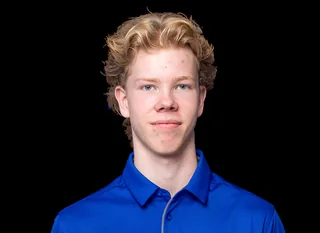 Sivert Nordheim |
- | 19 | 3.9 | 1.5 | 0.5 | 0.1 | 0.1 | 0.1 | 0.1 | 1.6 | 0.5 | - | - | - | - | 35.5 | 16.7 | 80.0 | -1.14 | 42.2 | 38.7 |
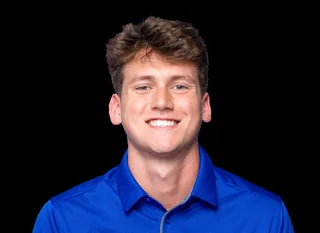 Cooper Bean |
- | 17 | 4.6 | 1.3 | 0.3 | 0.5 | 0.2 | 0.0 | 0.4 | 1.1 | 0.9 | - | - | - | - | 50.0 | 33.3 | 0.0 | -1.31 | 58.3 | 61.1 |
 Caden Huttenlocker |
- | 9 | 2.2 | 0.7 | 0.2 | 0.1 | 0.0 | 0.0 | 0.0 | 1.1 | -0.1 | - | - | - | - | 20.0 | 25.0 | 0 | -0.82 | 30.0 | 30.0 |
 Martin Kaupanger |
G | 0 | - | 0.0 | 0.0 | 0.0 | - | - | - | - | - | - | - | - | - | - | - | - | - | - | - |
Numbers/Game vs RAPM
X-axis = Numbers/Game (PTS+REB+AST+STL+BLK-TO-FGA), Y-axis = RAPM.
Advanced: Numbers = PTS+REB+AST+STL+BLK-TO-FGA, PM = total +/-, PM/G = per game, PM/40 = per 40 minutes, RAPM = Regularized Adj Plus-Minus, TS% = True Shooting, eFG% = Effective FG
Alumni in the Pros
Former Indiana State players in NBA 2026-2027, G League 2025-2026, matched by provider player ids (ESPN athlete ids, ESPN bios, linked StatsNBA/EuroLeague ids). Only games after their last Indiana State game count. These are observed results, not certified complete seasons. League and team are where each player last played a regular-season or playoff game (NBA ahead of G League when he played in both); recent games include the preseason.
Active alumni
| Player | At School | League | Team | GP | MPG | PPG | RPG | APG |
|---|---|---|---|---|---|---|---|---|
| J. LaRavia | 2019-21 | NBA | Los Angeles Lakers | 4 | 24.0 | 5.5 | 4.5 | 0.8 |
| J. Kent | 2022-24 | NBA | Portland Trail Blazers + G League 31 GP | 1 | 7.0 | 0.0 | 1.0 | 0.0 |
| T. Key | 2017-21 | G League | Raptors 905 | 32 | 27.3 | 16.9 | 2.6 | 1.8 |
Alumni around the leagues: recent games
| Date | Player | League | Team | Opponent | MIN | PTS | REB | AST | Box |
|---|---|---|---|---|---|---|---|---|---|
| 2026-10-30 | J. LaRavia | NBA | Los Angeles Lakers | @ Golden State Warriors | 28 | 10 | 2 | 0 | Box |
| 2026-10-28 | J. LaRavia | NBA | Los Angeles Lakers | @ LA Clippers | 35 | 2 | 10 | 0 | Box |
| 2026-10-25 | J. LaRavia | NBA | Los Angeles Lakers | @ Utah Jazz | 15 | 0 | 4 | 1 | Box |
| 2026-10-21 | J. Kent | NBA | Portland Trail Blazers | vs Phoenix Suns | 7 | 0 | 1 | 0 | Box |
| 2026-10-16 | T. Key | NBA Preseason | Toronto Raptors | @ Detroit Pistons | 30 | 13 | 1 | 3 | Box |
| 2026-10-16 | J. Kent | NBA Preseason | Portland Trail Blazers | @ Golden State Warriors | 12 | 3 | 2 | 1 | Box |
| 2026-10-15 | T. Key | NBA Preseason | Toronto Raptors | @ New York Knicks | 0 | 0 | 0 | 0 | Box |
| 2026-10-13 | T. Key | NBA Preseason | Toronto Raptors | vs New York Knicks | 6 | 11 | 0 | 0 | Box |
| 2026-10-13 | J. Kent | NBA Preseason | Portland Trail Blazers | @ Sacramento Kings | 9 | 2 | 2 | 0 | Box |
2025-2026 Shot Zones
1862 located field-goal attempts in 32 games (ESPN). Each zone is coloured by the player with the largest share of the team's made-shot points there (left) and of its misses there (right).
Ian ScottCamp WagnerSterling YoungXavier HallJo Van Buggenhout
| Zone | FGM-FGA | FG% | Pts | Top scorer | Runner-up | Most misses | Runner-up |
|---|---|---|---|---|---|---|---|
| Restricted area | 329-478 | 68.8 | 658 | Ian Scott 30% (200 pts) | Enel St. Bernard 17% (112 pts) | Ian Scott 19% (29 misses) | Camp Wagner 17% (26 misses) |
| Paint (non-RA) | 243-479 | 50.7 | 486 | Ian Scott 19% (92 pts) | Xavier Hall 13% (64 pts) | Sterling Young 18% (42 misses) | Ian Scott 15% (36 misses) |
| Mid-range left | 12-34 | 35.3 | 24 | Camp Wagner 25% (6 pts) | Jo Van Buggenhout 25% (6 pts) | Xavier Hall 23% (5 misses) | Camp Wagner 18% (4 misses) |
| Mid-range center | 5-10 | 50.0 | 10 | Jo Van Buggenhout 40% (4 pts) | Camp Wagner 20% (2 pts) | Jo Van Buggenhout 40% (2 misses) | Bruno Alocen 20% (1 misses) |
| Mid-range right | 16-33 | 48.5 | 32 | Jo Van Buggenhout 44% (14 pts) | Camp Wagner 12% (4 pts) | Jo Van Buggenhout 24% (4 misses) | Camp Wagner 18% (3 misses) |
| Left corner 3 | 24-81 | 29.6 | 72 | Sterling Young 25% (18 pts) | Camp Wagner 21% (15 pts) | Camp Wagner 19% (11 misses) | Sterling Young 19% (11 misses) |
| Right corner 3 | 26-72 | 36.1 | 78 | Camp Wagner 27% (21 pts) | Bruno Alocen 12% (9 pts) | Camp Wagner 41% (19 misses) | Sterling Young 13% (6 misses) |
| Above-break 3 left | 95-282 | 33.7 | 285 | Camp Wagner 32% (90 pts) | Bruno Alocen 18% (51 pts) | Camp Wagner 22% (42 misses) | Sterling Young 20% (38 misses) |
| Above-break 3 center | 34-136 | 25.0 | 102 | Camp Wagner 29% (30 pts) | Jo Van Buggenhout 18% (18 pts) | Camp Wagner 30% (31 misses) | Xavier Hall 14% (14 misses) |
| Above-break 3 right | 81-257 | 31.5 | 243 | Camp Wagner 33% (81 pts) | Sterling Young 20% (48 pts) | Camp Wagner 30% (52 misses) | Sterling Young 15% (27 misses) |