 Wichita State
2026-2027 Team Stats (3 games)
Model Outputs
Output is shown as model rating with league rank in parentheses when available.
| Model | Output | Notes |
|---|---|---|
| Elo Elo Streaming paired-comparison rating with recency baked into sequential updates. More → | 1253 (#54) | Preseason prior 1260 (returning production + recruiting): last season 1135, returning +99, transfers +42, freshmen -16 |
| Bradley-Terry Bradley-Terry Static logistic paired-comparison model with one team strength parameter. More → | 1159 (#49) | HCA +206 elo |
| Bradley-Terry Recency Bradley-Terry Recency Static Bradley-Terry with exponential recency weights on newer games. More → | 1155 (#49) | HCA +205 elo |
| Margin Margin Linear team-strength model fit on point differential instead of binary wins. More → | +14.7 (#53) | HCA +2.2 |
| Margin Recency Margin Recency Margin regression with exponential recency weights on newer games. More → | +14.6 (#53) | HCA +2.2 |
| Pythagorean Pythagorean Pythagorean win expectation from raw points scored and allowed. More → | 0.718 (#100) | - |
| Adjusted Efficiency Adjusted Efficiency Opponent-adjusted efficiency model with separate offensive and defensive components. More → | 0.680 (#85) | AdjNet +6.0 |
| Log Adjusted Log Adjusted Log-scale adjusted efficiency model that downweights blowout leverage. More → | 0.690 (#86) | AdjNet +6.7 |
| Points Off/Def Points Off/Def Raw points regression with separate offensive and defensive team parameters. More → | 0.685 (#68) | AdjO 76.8 | AdjD 72.0 |
| Points Off/Def Recency Points Off/Def Recency Off/def points regression with exponential recency weights. More → | 0.683 (#68) | AdjO 76.9 | AdjD 72.1 |
| Core Ensemble Core Ensemble Equal-logit blend of Elo, recency BT, recency margin, log-adjusted pyth, and points off/def. More → | 0.739 (#72) | Blend of Elo, BT, Margin, PythLog, PtsOD |
| Recency Ensemble Recency Ensemble Equal-logit blend of Elo, recency BT, recency margin, log-adjusted pyth, and recency points off/def. More → | 0.738 (#72) | Blend of Elo, BT, Margin, PythLog, PtsOD |
| Dynamic Bradley-Terry Dynamic Bradley-Terry Time-evolving paired-comparison model with latent team strength drift. More → | 1165 (#69) | RD 196 | GP 2 |
| Adjusted Context Blend Adjusted Context Blend Chronologically trained component blend with rest and signed venue context. More → | 0.769 (#56) | Chronological component blend with rest and venue. |
Rank through the season
League rank each week from the model's fit of the games played by then, published the same way as the table above, so each line ends at the rank shown there. Select a point for its rating.
2026-2027 Schedule & Results
| Date | Vs/At | Opponent | Result | Score |
|---|---|---|---|---|
| 2026-11-04 | vs | Cal State Northridge Matadors | W | 79 - 67 |
| 2026-11-08 | @ | USC Trojans | L | 86 - 93 |
| 2026-11-11 | vs | Friends Falcons | W | 113 - 60 |
| 2026-11-14 | vs | Austin Peay Governors | - | Preview |
| 2026-11-18 | @ | Loyola Chicago Ramblers | - | Preview |
| 2026-11-21 | vs | New Mexico Lobos | - | Preview |
2026-2027 Roster
Estimated Minutes by Position
Estimated from roster positions, box scores and minutes played. Each column totals one game's minutes, divided among the players. Use the labels or legend to highlight a player's estimated role.
| Player | Pos | GP | MIN | PTS | REB | AST | STL | BLK | TO | FGA | Numbers | PM | PM GP | PM/G | PM/40 | FG% | 3P% | FT% | RAPM | TS% | eFG% |
|---|---|---|---|---|---|---|---|---|---|---|---|---|---|---|---|---|---|---|---|---|---|
 Will Berg |
C | 2 | 24.5 | 21.5 | 13.5 | 1.0 | 1.0 | 1.0 | 2.0 | 11.5 | 24.5 | 14 | 2 | 7.0 | 11.6 | 69.6 | 0 | 78.6 | 1.17 | 73.7 | 69.6 |
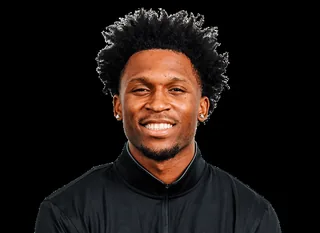 Kenyon Giles |
G | 3 | 27.0 | 16.0 | 1.7 | 4.7 | 1.0 | 0.0 | 1.0 | 12.3 | 10.0 | -2 | 2 | -1.0 | -1.2 | 45.9 | 44.4 | 75.0 | 0.25 | 59.2 | 56.8 |
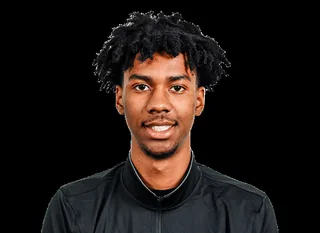 Dillon Battie |
F | 2 | 25.5 | 12.0 | 4.5 | 1.0 | 0.5 | 0.0 | 1.5 | 9.0 | 7.5 | -8 | 1 | -8.0 | -10.6 | 50.0 | 42.9 | 75.0 | 0.04 | 60.7 | 58.3 |
 Jordan Frison |
G | 3 | 23.3 | 9.0 | 2.0 | 6.0 | 1.0 | 0.0 | 1.3 | 7.7 | 9.0 | 15 | 2 | 7.5 | 11.0 | 34.8 | 0.0 | 91.7 | -0.21 | 47.7 | 34.8 |
 Desmeon Jones |
G | 1 | 18.0 | 9.0 | 1.0 | 1.0 | 0.0 | 0.0 | 2.0 | 5.0 | 4.0 | - | - | - | - | 80.0 | 100.0 | 0 | - | 90.0 | 90.0 |
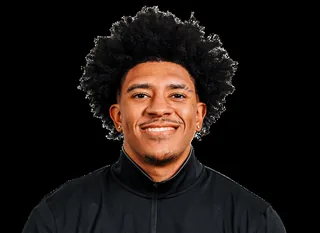 Michael Gray Jr. |
G | 3 | 12.7 | 8.7 | 2.0 | 0.3 | 0.7 | 0.3 | 0.3 | 5.0 | 6.7 | 14 | 2 | 7.0 | 16.0 | 46.7 | 53.8 | 83.3 | 1.5 | 73.7 | 70.0 |
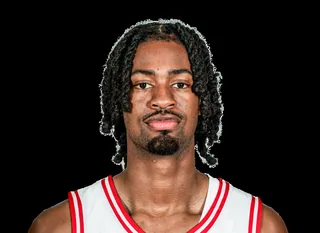 Bryce Heard |
G | 3 | 24.3 | 8.0 | 4.0 | 0.0 | 0.0 | 0.0 | 1.0 | 5.0 | 6.0 | 10 | 2 | 5.0 | 6.8 | 53.3 | 55.6 | 75.0 | -0.34 | 71.6 | 70.0 |
 Tj Williams |
G | 1 | 12.0 | 7.0 | 7.0 | 1.0 | 0.0 | 0.0 | 1.0 | 5.0 | 9.0 | - | - | - | - | 60.0 | 100.0 | 0 | - | 70.0 | 70.0 |
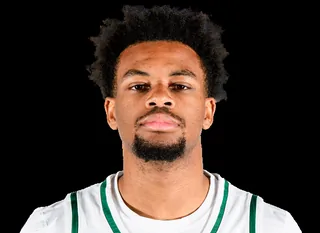 Jahari Long |
G | 3 | 27.7 | 6.7 | 3.3 | 1.3 | 1.0 | 0.3 | 1.0 | 5.3 | 6.3 | -2 | 2 | -1.0 | -1.3 | 31.2 | 50.0 | 60.0 | -0.18 | 49.0 | 43.8 |
 Joy Ighovodja |
G | 3 | 7.0 | 6.3 | 1.0 | 1.0 | 0.0 | 0.0 | 0.0 | 2.3 | 6.0 | -6 | 2 | -3.0 | -114.3 | 100.0 | 100.0 | 0 | -0.48 | 135.7 | 135.7 |
 Tyrus Rathan-Mayes |
G | 1 | 13.0 | 4.0 | 3.0 | 3.0 | 1.0 | 1.0 | 0.0 | 3.0 | 9.0 | - | - | - | - | 66.7 | 0.0 | 0.0 | - | 58.1 | 66.7 |
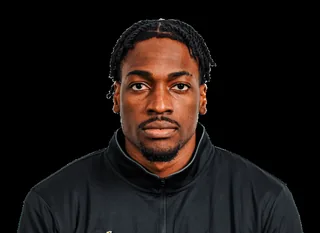 Emmanuel Okorafor |
F | 3 | 13.0 | 3.7 | 5.0 | 0.3 | 0.0 | 1.3 | 1.3 | 3.0 | 6.0 | 0 | 2 | 0.0 | 0.0 | 55.6 | 0 | 16.7 | -0.82 | 47.3 | 55.6 |
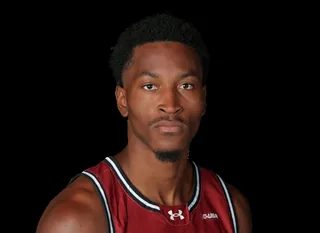 Cyr Malonga |
C | 2 | 10.5 | 3.5 | 3.0 | 0.0 | 0.5 | 0.0 | 0.0 | 2.0 | 5.0 | -6 | 1 | -6.0 | -45.6 | 50.0 | 0 | 50.0 | -1.03 | 52.7 | 50.0 |
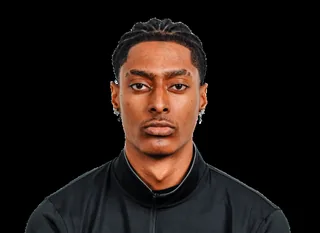 Jaret Valencia |
F | 3 | 8.7 | 3.0 | 2.0 | 0.7 | 0.0 | 0.0 | 0.3 | 2.0 | 3.3 | -4 | 2 | -2.0 | -11.5 | 33.3 | 0.0 | 100.0 | -0.87 | 54.9 | 33.3 |
 Pierre Couisnard |
G | 0 | - | 0.0 | 0.0 | 0.0 | - | - | - | - | - | - | - | - | - | - | - | - | - | - | - |
 Noah Hill |
F | 0 | - | 0.0 | 0.0 | 0.0 | - | - | - | - | - | - | - | - | - | - | - | - | - | - | - |
 Henry Thengvall |
F | 1 | 5.0 | 0.0 | 1.0 | 2.0 | 0.0 | 0.0 | 2.0 | 2.0 | -1.0 | - | - | - | - | 0.0 | 0.0 | 0 | - | 0.0 | 0.0 |
Numbers/Game vs RAPM
X-axis = Numbers/Game (PTS+REB+AST+STL+BLK-TO-FGA), Y-axis = RAPM.
Advanced: Numbers = PTS+REB+AST+STL+BLK-TO-FGA, PM = total +/-, PM/G = per game, PM/40 = per 40 minutes, RAPM = Regularized Adj Plus-Minus, TS% = True Shooting, eFG% = Effective FG
Alumni in the Pros
Former Wichita State players in NBA 2026-2027, EuroLeague 2026-2027, G League 2026-2027, EuroCup 2026-2027, matched by provider player ids (ESPN athlete ids, ESPN bios, linked StatsNBA/EuroLeague ids). Only games after their last Wichita State game count. These are observed results, not certified complete seasons. League and team are where each player last played a regular-season or playoff game (NBA ahead of G League when he played in both); recent games include the preseason.
Active alumni
| Player | At School | League | Team | GP | MPG | PPG | RPG | APG | Last game | Last 30 days |
|---|---|---|---|---|---|---|---|---|---|---|
| Austin Reaves | 2016-18 | NBA | Los Angeles Lakers | 12 | 35.3 | 24.7 | 3.3 | 4.7 | 11-11 18 pts, 3 reb, 5 ast | 12 GP, 24.7 PPG, 3.3 RPG, 4.7 APG |
| Fred VanVleet | 2012-16 | NBA | Houston Rockets | 11 | 30.3 | 14.0 | 3.0 | 5.4 | 11-13 17 pts, 2 reb, 3 ast | 11 GP, 14.0 PPG, 3.0 RPG, 5.4 APG |
| Landry Shamet | 2015-18 | NBA | New York Knicks | 12 | 25.5 | 9.2 | 1.8 | 2.0 | 11-13 5 pts, 3 reb, 1 ast | 12 GP, 9.2 PPG, 1.8 RPG, 2.0 APG |
| Craig Porter Jr. | 2020-23 | NBA | Cleveland Cavaliers | 10 | 10.0 | 1.4 | 1.7 | 1.4 | 11-13 0 pts, 2 reb, 2 ast | 10 GP, 1.4 PPG, 1.7 RPG, 1.4 APG |
| Tyson Etienne | 2019-22 | EuroLeague | Paris Basketball | 10 | 20.2 | 14.3 | 1.1 | 2.4 | 11-11 11 pts, 0 reb, 2 ast | 5 GP, 13.8 PPG, 0.8 RPG, 2.2 APG |
| Ricky Council IV | 2020-22 | G League | Osceola Magic | 0 | - | - | - | - | 11-12 11 pts, 3 reb, 6 ast Play-In | 3 GP, 12.7 PPG, 6.7 RPG, 2.7 APG |
| Erik Stevenson | 2018-20 | EuroCup | Roma Basketball | 7 | 23.5 | 9.9 | 4.3 | 2.1 | 11-11 8 pts, 10 reb, 4 ast | 4 GP, 13.2 PPG, 5.2 RPG, 3.0 APG |
Alumni around the leagues: recent games
| Date | Player | League | Team | Opponent | MIN | PTS | REB | AST | Box |
|---|---|---|---|---|---|---|---|---|---|
| 2026-11-13 | Landry Shamet | NBA | New York Knicks | @ Indiana Pacers | 21 | 5 | 3 | 1 | Box |
| 2026-11-13 | Fred VanVleet | NBA | Houston Rockets | vs Utah Jazz | 34 | 17 | 2 | 3 | Box |
| 2026-11-13 | Craig Porter Jr. | NBA | Cleveland Cavaliers | @ Miami Heat | 9 | 0 | 2 | 2 | Box |
| 2026-11-12 | Ricky Council IV | G League Play-In | Osceola Magic | vs Mexico City Capitanes | 32 | 11 | 3 | 6 | Box |
| 2026-11-11 | Tyson Etienne | EuroLeague | Paris Basketball | vs Fenerbahce Tarfin Istanbul | 21 | 11 | 0 | 2 | Box |
| 2026-11-11 | Landry Shamet | NBA | New York Knicks | vs Cleveland Cavaliers | 29 | 12 | 2 | 4 | Box |
| 2026-11-11 | Fred VanVleet | NBA | Houston Rockets | vs Golden State Warriors | 30 | 18 | 2 | 6 | Box |
| 2026-11-11 | Erik Stevenson | EuroCup | Roma Basketball | vs ratiopharm ulm | 26 | 8 | 10 | 4 | Box |
| 2026-11-11 | Austin Reaves | NBA | Los Angeles Lakers | @ Milwaukee Bucks | 25 | 18 | 3 | 5 | Box |
| 2026-11-10 | Ricky Council IV | G League Play-In | Osceola Magic | @ Memphis Hustle | 36 | 24 | 12 | 2 | Box |
| 2026-11-10 | Landry Shamet | NBA | New York Knicks | vs Milwaukee Bucks | 28 | 10 | 3 | 2 | Box |
| 2026-11-09 | Fred VanVleet | NBA | Houston Rockets | vs Denver Nuggets | 30 | 12 | 1 | 2 | Box |
| 2026-11-09 | Craig Porter Jr. | NBA | Cleveland Cavaliers | @ Charlotte Hornets | 17 | 9 | 2 | 4 | Box |
| 2026-11-08 | Ricky Council IV | G League Play-In | Osceola Magic | vs Oklahoma City Blue | 17 | 3 | 5 | 0 | Box |
| 2026-11-08 | Austin Reaves | NBA | Los Angeles Lakers | @ Detroit Pistons | 37 | 43 | 5 | 4 | Box |
| 2026-11-07 | Craig Porter Jr. | NBA | Cleveland Cavaliers | vs New York Knicks | 15 | 0 | 1 | 1 | Box |
| 2026-11-06 | Austin Reaves | NBA | Los Angeles Lakers | vs Portland Trail Blazers | 38 | 25 | 3 | 2 | Box |
| 2026-11-05 | Tyson Etienne | EuroLeague | Paris Basketball | @ Anadolu Efes Istanbul | 22 | 12 | 0 | 0 | Box |
| 2026-11-03 | Erik Stevenson | EuroCup | Roma Basketball | @ PAOK Thessaloniki | 27 | 16 | 7 | 6 | Box |
| 2026-10-29 | Tyson Etienne | EuroLeague | Paris Basketball | @ Maccabi Rapyd Tel Aviv | 18 | 13 | 1 | 1 | Box |
| 2026-10-27 | Erik Stevenson | EuroCup | Roma Basketball | vs BOSNA BH Telecom Sarajevo | 24 | 16 | 3 | 1 | Box |
2026-2027 Shot Zones
188 located field-goal attempts in 3 games (ESPN). Each zone is coloured by the player with the largest share of the team's made-shot points there (left) and of its misses there (right).
Kenyon GilesWill BergBryce HeardDillon BattieMichael Gray Jr.Jordan FrisonJahari LongDesmeon Jones
| Zone | FGM-FGA | FG% | Pts | Top scorer | Runner-up | Most misses | Runner-up |
|---|---|---|---|---|---|---|---|
| Restricted area | 43-63 | 68.3 | 86 | Will Berg 26% (22 pts) | Kenyon Giles 14% (12 pts) | Jordan Frison 25% (5 misses) | Dillon Battie 15% (3 misses) |
| Paint (non-RA) | 13-41 | 31.7 | 26 | Will Berg 38% (10 pts) | Jordan Frison 31% (8 pts) | Jordan Frison 21% (6 misses) | Jahari Long 18% (5 misses) |
| Mid-range left | 1-4 | 25.0 | 2 | Desmeon Jones 100% (2 pts) | - | Kenyon Giles 67% (2 misses) | Jordan Frison 33% (1 misses) |
| Mid-range center | 1-2 | 50.0 | 2 | Jordan Frison 100% (2 pts) | - | Jahari Long 100% (1 misses) | - |
| Mid-range right | 3-7 | 42.9 | 6 | Kenyon Giles 67% (4 pts) | Bryce Heard 33% (2 pts) | Kenyon Giles 50% (2 misses) | Bryce Heard 25% (1 misses) |
| Left corner 3 | 5-8 | 62.5 | 15 | Jahari Long 40% (6 pts) | Michael Gray Jr. 40% (6 pts) | Dillon Battie 33% (1 misses) | Jahari Long 33% (1 misses) |
| Right corner 3 | 4-6 | 66.7 | 12 | Bryce Heard 50% (6 pts) | Joy Ighovodja 25% (3 pts) | Bryce Heard 50% (1 misses) | Dillon Battie 50% (1 misses) |
| Above-break 3 left | 10-21 | 47.6 | 30 | Kenyon Giles 30% (9 pts) | Michael Gray Jr. 20% (6 pts) | Michael Gray Jr. 36% (4 misses) | Jahari Long 18% (2 misses) |
| Above-break 3 center | 2-8 | 25.0 | 6 | Dillon Battie 50% (3 pts) | Kenyon Giles 50% (3 pts) | Kenyon Giles 50% (3 misses) | Jahari Long 17% (1 misses) |
| Above-break 3 right | 13-28 | 46.4 | 39 | Kenyon Giles 31% (12 pts) | Bryce Heard 23% (9 pts) | Kenyon Giles 40% (6 misses) | Bryce Heard 13% (2 misses) |