 Utah State
2026-2027 Team Stats (5 games)
Model Outputs
Output is shown as model rating with league rank in parentheses when available.
| Model | Output | Notes |
|---|---|---|
| Elo Elo Streaming paired-comparison rating with recency baked into sequential updates. More → | 674 (#344) | Preseason prior 677 (returning production + recruiting): last season 814, returning -84, transfers -54, freshmen +0 |
| Bradley-Terry Bradley-Terry Static logistic paired-comparison model with one team strength parameter. More → | 786 (#343) | HCA +169 elo |
| Bradley-Terry Recency Bradley-Terry Recency Static Bradley-Terry with exponential recency weights on newer games. More → | 789 (#343) | HCA +169 elo |
| Margin Margin Linear team-strength model fit on point differential instead of binary wins. More → | -10.0 (#262) | HCA +1.7 |
| Margin Recency Margin Recency Margin regression with exponential recency weights on newer games. More → | -9.8 (#262) | HCA +1.6 |
| Pythagorean Pythagorean Pythagorean win expectation from raw points scored and allowed. More → | 0.032 (#333) | - |
| Adjusted Efficiency Adjusted Efficiency Opponent-adjusted efficiency model with separate offensive and defensive components. More → | 0.160 (#327) | AdjNet -14.7 |
| Log Adjusted Log Adjusted Log-scale adjusted efficiency model that downweights blowout leverage. More → | 0.160 (#325) | AdjNet -14.0 |
| Points Off/Def Points Off/Def Raw points regression with separate offensive and defensive team parameters. More → | 0.217 (#327) | AdjO 55.0 | AdjD 66.3 |
| Points Off/Def Recency Points Off/Def Recency Off/def points regression with exponential recency weights. More → | 0.221 (#327) | AdjO 55.1 | AdjD 66.3 |
| Core Ensemble Core Ensemble Equal-logit blend of Elo, recency BT, recency margin, log-adjusted pyth, and points off/def. More → | 0.212 (#315) | Blend of Elo, BT, Margin, PythLog, PtsOD |
| Recency Ensemble Recency Ensemble Equal-logit blend of Elo, recency BT, recency margin, log-adjusted pyth, and recency points off/def. More → | 0.212 (#315) | Blend of Elo, BT, Margin, PythLog, PtsOD |
| Dynamic Bradley-Terry Dynamic Bradley-Terry Time-evolving paired-comparison model with latent team strength drift. More → | 785 (#334) | RD 166 | GP 4 |
| Adjusted Context Blend Adjusted Context Blend Chronologically trained component blend with rest and signed venue context. More → | 0.138 (#334) | Chronological component blend with rest and venue. |
Rank through the season
League rank each week from the model's fit of the games played by then, published the same way as the table above, so each line ends at the rank shown there. Select a point for its rating.
2026-2027 Schedule & Results
| Date | Vs/At | Opponent | Result | Score |
|---|---|---|---|---|
| 2026-11-02 | vs | Westminster (UT) Griffins | W | 61 - 45 |
| 2026-11-06 | vs | Loyola Marymount Lions | L | 45 - 70 |
| 2026-11-08 | @ | USC Trojans | L | 40 - 118 |
| 2026-11-11 | vs | Idaho State Bengals | L | 41 - 54 |
| 2026-11-13 | vs | Bethune-Cookman Wildcats | W | 83 - 60 |
| 2026-11-18 | @ | BYU Cougars | - | Preview |
2026-2027 Roster
Estimated Minutes by Position
Estimated from roster positions, box scores and minutes played. Each column totals one game's minutes, divided among the players. Use the labels or legend to highlight a player's estimated role.
| Player | Pos | GP | MIN | PTS | REB | AST | STL | BLK | TO | FGA | Numbers | PM | PM GP | PM/G | PM/40 | FG% | 3P% | FT% | RAPM | TS% | eFG% |
|---|---|---|---|---|---|---|---|---|---|---|---|---|---|---|---|---|---|---|---|---|---|
 Nicole Ogun |
F | 5 | 23.8 | 11.2 | 7.8 | 1.4 | 1.6 | 0.6 | 1.2 | 9.6 | 11.8 | -7 | 5 | -1.4 | -2.4 | 47.9 | 0 | 47.6 | 2.79 | 48.9 | 47.9 |
 Lisa Thompson |
G | 5 | 20.2 | 9.2 | 3.4 | 1.8 | 1.2 | 0.0 | 1.6 | 8.4 | 5.6 | -24 | 5 | -4.8 | -9.3 | 31.0 | 10.0 | 82.6 | -0.43 | 44.1 | 32.1 |
 Sami Mancini |
F | 5 | 24.8 | 8.8 | 6.4 | 1.0 | 0.6 | 0.8 | 3.2 | 9.0 | 5.4 | -70 | 5 | -14.0 | -22.7 | 40.0 | 40.0 | 50.0 | -5.02 | 43.8 | 42.2 |
 Kylani Rookstool |
F | 5 | 29.8 | 7.6 | 2.0 | 1.2 | 1.0 | 0.4 | 2.2 | 6.4 | 3.6 | -57 | 5 | -11.4 | -15.3 | 40.6 | 33.3 | 60.0 | -0.31 | 52.2 | 50.0 |
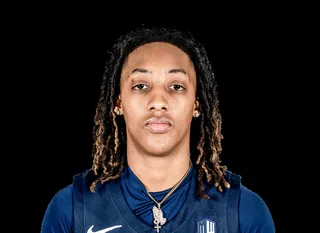 Aaliyah Gayles |
G | 4 | 21.5 | 4.8 | 3.2 | 1.5 | 0.8 | 0.0 | 3.8 | 4.8 | 1.8 | -67 | 4 | -16.8 | -31.1 | 26.3 | 20.0 | 70.0 | -1.24 | 40.6 | 31.6 |
 Acacia Hayes |
G | 4 | 21.8 | 4.5 | 1.2 | 1.2 | 0.0 | 0.5 | 2.5 | 4.5 | 0.5 | -42 | 4 | -10.5 | -19.6 | 33.3 | 22.2 | 100.0 | 0.56 | 45.5 | 38.9 |
 Mirembe Twehamye Montanana |
G | 5 | 23.8 | 4.0 | 2.6 | 1.8 | 1.2 | 0.0 | 2.4 | 4.2 | 3.0 | -39 | 5 | -7.8 | -13.2 | 38.1 | 50.0 | 50.0 | -0.39 | 45.7 | 45.2 |
 Macie Brown |
F | 4 | 10.0 | 2.5 | 2.8 | 0.0 | 0.8 | 0.0 | 0.5 | 1.5 | 4.0 | 2 | 4 | 0.5 | 2.0 | 66.7 | 0 | 100.0 | -1.13 | 72.7 | 66.7 |
 Aitana Rosello Lopez |
G | 5 | 18.6 | 2.0 | 1.0 | 1.2 | 1.4 | 0.2 | 1.2 | 3.4 | 1.2 | -30 | 5 | -6.0 | -12.9 | 23.5 | 0.0 | 50.0 | -4.04 | 26.7 | 23.5 |
 Catalina Roco |
G | 5 | 6.6 | 1.0 | 0.6 | 0.2 | 0.6 | 0.0 | 0.0 | 1.8 | 0.6 | -2 | 5 | -0.4 | -2.5 | 22.2 | 14.3 | 0 | 0.02 | 27.8 | 27.8 |
 Paloma Munoz Herreros |
G | 5 | 4.8 | 0.8 | 1.0 | 0.0 | 0.0 | 0.0 | 1.4 | 1.2 | -0.8 | -28 | 5 | -5.6 | -43.4 | 16.7 | 0.0 | 100.0 | -3.62 | 29.1 | 16.7 |
 Bella Cosme |
G | 5 | 3.8 | 0.0 | 0.0 | 0.0 | 0.0 | 0.0 | 0.0 | 0.8 | -0.8 | -10 | 5 | -2.0 | -21.8 | 0.0 | 0.0 | 0 | -3.71 | 0.0 | 0.0 |
 Saskia Kruger |
F | 3 | 2.0 | 0.0 | 0.0 | 0.0 | 0.0 | 0.3 | 0.3 | 0.3 | -0.3 | -11 | 3 | -3.7 | -65.7 | 0.0 | 0 | 0 | -1.89 | 0.0 | 0.0 |
 Danika Galea |
C | 0 | - | 0.0 | 0.0 | 0.0 | - | - | - | - | - | - | - | - | - | - | - | - | - | - | - |
 Addy Horsley |
G | 0 | - | 0.0 | 0.0 | 0.0 | - | - | - | - | - | - | - | - | - | - | - | - | - | - | - |
Numbers/Game vs RAPM
X-axis = Numbers/Game (PTS+REB+AST+STL+BLK-TO-FGA), Y-axis = RAPM.
Advanced: Numbers = PTS+REB+AST+STL+BLK-TO-FGA, PM = total +/-, PM/G = per game, PM/40 = per 40 minutes, RAPM = Regularized Adj Plus-Minus, TS% = True Shooting, eFG% = Effective FG
2026-2027 Shot Zones
268 located field-goal attempts in 5 games (ESPN). Each zone is coloured by the player with the largest share of the team's made-shot points there (left) and of its misses there (right).
Nicole OgunSami ManciniKylani RookstoolLisa ThompsonMirembe Twehamye MontananaAcacia HayesAaliyah GaylesAitana Rosello LopezCatalina Roco
| Zone | FGM-FGA | FG% | Pts | Top scorer | Runner-up | Most misses | Runner-up |
|---|---|---|---|---|---|---|---|
| Restricted area | 24-50 | 48.0 | 48 | Nicole Ogun 46% (22 pts) | Sami Mancini 21% (10 pts) | Nicole Ogun 31% (8 misses) | Mirembe Twehamye Montanana 19% (5 misses) |
| Paint (non-RA) | 48-109 | 44.0 | 96 | Nicole Ogun 25% (24 pts) | Sami Mancini 21% (20 pts) | Nicole Ogun 26% (16 misses) | Sami Mancini 26% (16 misses) |
| Mid-range left | 3-11 | 27.3 | 6 | Aitana Rosello Lopez 33% (2 pts) | Catalina Roco 33% (2 pts) | Lisa Thompson 50% (4 misses) | Aitana Rosello Lopez 25% (2 misses) |
| Mid-range center | 0-6 | 0.0 | 0 | - | - | Lisa Thompson 50% (3 misses) | Aaliyah Gayles 17% (1 misses) |
| Mid-range right | 5-16 | 31.2 | 10 | Lisa Thompson 60% (6 pts) | Kylani Rookstool 20% (2 pts) | Sami Mancini 36% (4 misses) | Aaliyah Gayles 18% (2 misses) |
| Left corner 3 | 0-7 | 0.0 | 0 | - | - | Kylani Rookstool 57% (4 misses) | Aaliyah Gayles 14% (1 misses) |
| Right corner 3 | 2-10 | 20.0 | 6 | Kylani Rookstool 50% (3 pts) | Lisa Thompson 50% (3 pts) | Kylani Rookstool 50% (4 misses) | Acacia Hayes 12% (1 misses) |
| Above-break 3 left | 0-22 | 0.0 | 0 | - | - | Catalina Roco 23% (5 misses) | Aaliyah Gayles 18% (4 misses) |
| Above-break 3 center | 7-15 | 46.7 | 21 | Kylani Rookstool 43% (9 pts) | Sami Mancini 29% (6 pts) | Aaliyah Gayles 25% (2 misses) | Lisa Thompson 25% (2 misses) |
| Above-break 3 right | 8-22 | 36.4 | 24 | Mirembe Twehamye Montanana 38% (9 pts) | Kylani Rookstool 25% (6 pts) | Acacia Hayes 36% (5 misses) | Kylani Rookstool 21% (3 misses) |