 Team WNBA
2024 Team Stats (1 games)
2024 Schedule & Results
2024 Roster
Minutes by Position
The surface stays filled across the five on-court roles. Use the labels or legend to isolate how each player absorbs guard-to-big minutes.
| Player | Pos | GP | MIN | PTS | REB | AST | STL | BLK | TO | FGA | Numbers | PM | PM GP | PM/G | PM/40 | FG% | 3P% | FT% | RAPM | TS% | eFG% |
|---|---|---|---|---|---|---|---|---|---|---|---|---|---|---|---|---|---|---|---|---|---|
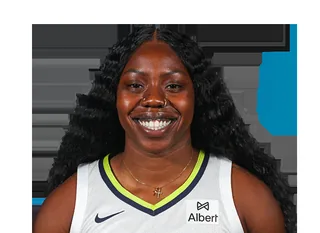 Arike Ogunbowale |
G | 1 | 31.0 | 34.0 | 3.0 | 6.0 | 2.0 | 0.0 | 1.0 | 20.0 | 24.0 | - | - | - | - | 50.0 | 61.5 | 85.7 | - | 73.7 | 70.0 |
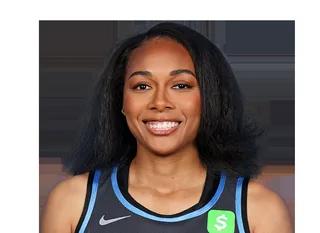 Allisha Gray |
G | 1 | 22.0 | 16.0 | 3.0 | 3.0 | 5.0 | 0.0 | 0.0 | 8.0 | 19.0 | - | - | - | - | 37.5 | 33.3 | 90.0 | - | 64.5 | 43.8 |
 Nneka Ogwumike |
F | 1 | 24.0 | 14.0 | 3.0 | 2.0 | 0.0 | 1.0 | 2.0 | 9.0 | 9.0 | - | - | - | - | 77.8 | 0.0 | 0 | - | 77.8 | 77.8 |
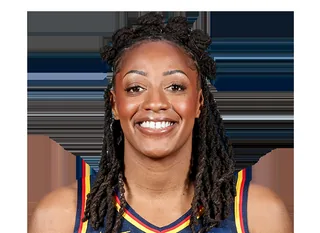 Kelsey Mitchell |
G | 1 | 14.0 | 13.0 | 0.0 | 1.0 | 2.0 | 0.0 | 0.0 | 8.0 | 8.0 | - | - | - | - | 75.0 | 33.3 | 0 | - | 81.2 | 81.2 |
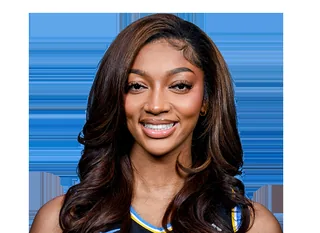 Angel Reese |
F | 1 | 18.0 | 12.0 | 11.0 | 0.0 | 1.0 | 1.0 | 0.0 | 10.0 | 15.0 | - | - | - | - | 50.0 | 0.0 | 100.0 | - | 55.1 | 50.0 |
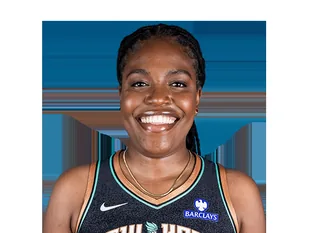 Jazmine Jones |
C | 1 | 16.0 | 6.0 | 7.0 | 5.0 | 1.0 | 1.0 | 0.0 | 6.0 | 14.0 | - | - | - | - | 50.0 | 0.0 | 0 | - | 50.0 | 50.0 |
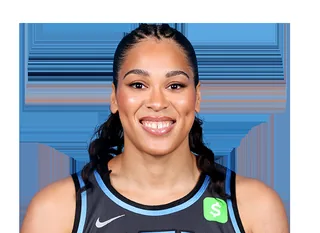 Brionna Jones |
F | 1 | 8.0 | 6.0 | 2.0 | 0.0 | 0.0 | 0.0 | 0.0 | 6.0 | 2.0 | - | - | - | - | 50.0 | 0.0 | 0 | - | 50.0 | 50.0 |
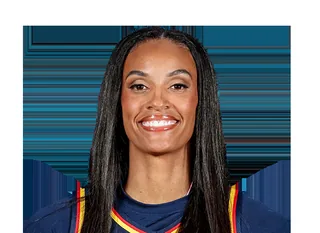 DeWanna Bonner |
F | 1 | 16.0 | 5.0 | 4.0 | 0.0 | 0.0 | 0.0 | 0.0 | 6.0 | 3.0 | - | - | - | - | 33.3 | 33.3 | 0 | - | 41.7 | 41.7 |
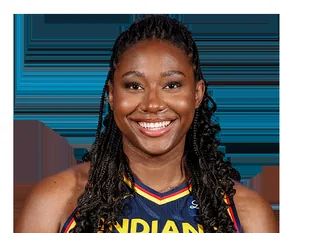 Aliyah Boston |
F | 1 | 9.0 | 4.0 | 2.0 | 1.0 | 0.0 | 0.0 | 2.0 | 3.0 | 2.0 | - | - | - | - | 66.7 | 0.0 | 0.0 | - | 58.1 | 66.7 |
 Caitlin Clark |
G | 1 | 26.0 | 4.0 | 1.0 | 10.0 | 2.0 | 0.0 | 2.0 | 9.0 | 6.0 | - | - | - | - | 22.2 | 0.0 | 0 | - | 22.2 | 22.2 |
 Kayla McBride |
G | 1 | 11.0 | 3.0 | 0.0 | 2.0 | 0.0 | 0.0 | 0.0 | 1.0 | 4.0 | - | - | - | - | 100.0 | 100.0 | 0 | - | 150.0 | 150.0 |
 Dearica Hamby |
F | 1 | 4.0 | 0.0 | 2.0 | 1.0 | 1.0 | 0.0 | 1.0 | 2.0 | 1.0 | - | - | - | - | 0.0 | 0 | 0 | - | 0.0 | 0.0 |
Numbers/Game vs RAPM
Not enough players with both Numbers/Game and RAPM to plot.
Advanced: Numbers = PTS+REB+AST+STL+BLK-TO-FGA, PM = total +/-, PM/G = per game, PM/40 = per 40 minutes, RAPM = Regularized Adj Plus-Minus, TS% = True Shooting, eFG% = Effective FG
2024 Shot Zones
88 located field-goal attempts in 1 game (ESPN). Each zone is coloured by the player with the largest share of the team's made-shot points there (left) and of its misses there (right).
Arike OgunbowaleNneka OgwumikeAngel ReeseAllisha GrayBrionna JonesCaitlin Clark
| Zone | FGM-FGA | FG% | Pts | Top scorer | Runner-up | Most misses | Runner-up |
|---|---|---|---|---|---|---|---|
| Restricted area | 17-22 | 77.3 | 34 | Angel Reese 24% (8 pts) | Allisha Gray 12% (4 pts) | Angel Reese 40% (2 misses) | Arike Ogunbowale 20% (1 misses) |
| Paint (non-RA) | 9-17 | 52.9 | 18 | Nneka Ogwumike 44% (8 pts) | Aliyah Boston 11% (2 pts) | Allisha Gray 25% (2 misses) | Arike Ogunbowale 25% (2 misses) |
| Mid-range left | 2-3 | 66.7 | 4 | Arike Ogunbowale 50% (2 pts) | Kelsey Mitchell 50% (2 pts) | Angel Reese 100% (1 misses) | - |
| Mid-range center | 2-4 | 50.0 | 4 | Arike Ogunbowale 50% (2 pts) | Kelsey Mitchell 50% (2 pts) | Arike Ogunbowale 100% (2 misses) | - |
| Mid-range right | 2-6 | 33.3 | 4 | Brionna Jones 50% (2 pts) | Nneka Ogwumike 50% (2 pts) | Allisha Gray 25% (1 misses) | DeWanna Bonner 25% (1 misses) |
| Left corner 3 | 0-2 | 0.0 | 0 | - | - | Allisha Gray 50% (1 misses) | Angel Reese 50% (1 misses) |
| Right corner 3 | 0-0 | - | 0 | - | - | - | - |
| Above-break 3 left | 5-16 | 31.2 | 15 | Arike Ogunbowale 80% (12 pts) | Kelsey Mitchell 20% (3 pts) | Arike Ogunbowale 27% (3 misses) | Caitlin Clark 27% (3 misses) |
| Above-break 3 center | 3-6 | 50.0 | 9 | Arike Ogunbowale 100% (9 pts) | - | Arike Ogunbowale 33% (1 misses) | Kelsey Mitchell 33% (1 misses) |
| Above-break 3 right | 4-12 | 33.3 | 12 | Allisha Gray 25% (3 pts) | Arike Ogunbowale 25% (3 pts) | Caitlin Clark 50% (4 misses) | DeWanna Bonner 25% (2 misses) |