 Seton Hall
2026-2027 Team Stats (3 games)
Model Outputs
Output is shown as model rating with league rank in parentheses when available.
| Model | Output | Notes |
|---|---|---|
| Elo Elo Streaming paired-comparison rating with recency baked into sequential updates. More → | 1222 (#67) | Preseason prior 1199 (returning production + recruiting): last season 1098, returning -23, transfers +140, freshmen -16 |
| Bradley-Terry Bradley-Terry Static logistic paired-comparison model with one team strength parameter. More → | 1155 (#55) | HCA +232 elo |
| Bradley-Terry Recency Bradley-Terry Recency Static Bradley-Terry with exponential recency weights on newer games. More → | 1101 (#36) | HCA +232 elo |
| Margin Margin Linear team-strength model fit on point differential instead of binary wins. More → | +1.9 (#133) | HCA +1.3 |
| Margin Recency Margin Recency Margin regression with exponential recency weights on newer games. More → | +1.7 (#134) | HCA +1.3 |
| Pythagorean Pythagorean Pythagorean win expectation from raw points scored and allowed. More → | 0.824 (#72) | - |
| Adjusted Efficiency Adjusted Efficiency Opponent-adjusted efficiency model with separate offensive and defensive components. More → | 0.676 (#87) | AdjNet +7.3 |
| Log Adjusted Log Adjusted Log-scale adjusted efficiency model that downweights blowout leverage. More → | 0.677 (#87) | AdjNet +7.3 |
| Points Off/Def Points Off/Def Raw points regression with separate offensive and defensive team parameters. More → | 0.635 (#82) | AdjO 66.8 | AdjD 63.1 |
| Points Off/Def Recency Points Off/Def Recency Off/def points regression with exponential recency weights. More → | 0.605 (#84) | AdjO 66.9 | AdjD 63.1 |
| Core Ensemble Core Ensemble Equal-logit blend of Elo, recency BT, recency margin, log-adjusted pyth, and points off/def. More → | 0.666 (#88) | Blend of Elo, BT, Margin, PythLog, PtsOD |
| Recency Ensemble Recency Ensemble Equal-logit blend of Elo, recency BT, recency margin, log-adjusted pyth, and recency points off/def. More → | 0.660 (#89) | Blend of Elo, BT, Margin, PythLog, PtsOD |
| Dynamic Bradley-Terry Dynamic Bradley-Terry Time-evolving paired-comparison model with latent team strength drift. More → | 1191 (#55) | RD 180 | GP 3 |
| Adjusted Context Blend Adjusted Context Blend Chronologically trained component blend with rest and signed venue context. More → | 0.710 (#87) | Chronological component blend with rest and venue. |
2026-2027 Schedule & Results
| Date | Vs/At | Opponent | Result | Score |
|---|---|---|---|---|
| 2026-11-02 | vs | Saint Peter's Peacocks | W | 66 - 42 |
| 2026-11-05 | vs | Long Island University Sharks | W | 67 - 60 |
| 2026-11-09 | @ | Charlotte 49ers | W | 68 - 62 |
| 2026-11-13 | @ | Alabama Crimson Tide | - | Preview |
2026-2027 Roster
Estimated Minutes by Position
Estimated from roster positions, box scores and minutes played. Each column totals one game's minutes, divided among the players. Use the labels or legend to highlight a player's estimated role.
| Player | Pos | GP | MIN | PTS | REB | AST | STL | BLK | TO | FGA | Numbers | PM | PM GP | PM/G | PM/40 | FG% | 3P% | FT% | RAPM | TS% | eFG% |
|---|---|---|---|---|---|---|---|---|---|---|---|---|---|---|---|---|---|---|---|---|---|
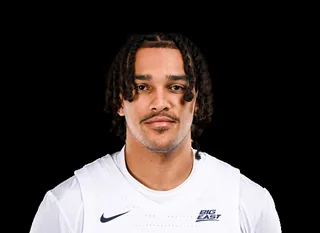 Roddie Anderson III |
G | 3 | 25.0 | 17.0 | 2.3 | 1.0 | 2.0 | 0.7 | 0.3 | 11.0 | 11.7 | 23 | 3 | 7.7 | 12.4 | 39.4 | 55.6 | 68.2 | -0.37 | 59.7 | 54.5 |
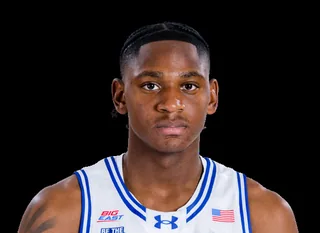 Elijah Fisher |
G | 3 | 28.3 | 8.3 | 5.7 | 2.3 | 2.0 | 0.3 | 2.3 | 5.3 | 11.0 | 26 | 3 | 8.7 | 12.2 | 43.8 | 33.3 | 90.9 | 0.74 | 60.0 | 46.9 |
 Terry Copeland Jr. |
F | 3 | 16.7 | 8.0 | 2.7 | 0.0 | 0.3 | 0.0 | 1.7 | 4.0 | 5.3 | 20 | 3 | 6.7 | 16.3 | 75.0 | 0 | 54.5 | 0.68 | 71.3 | 75.0 |
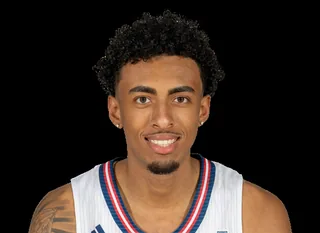 Devin Williams |
F | 3 | 19.0 | 8.0 | 4.3 | 2.0 | 0.0 | 1.3 | 0.3 | 6.3 | 9.0 | 23 | 3 | 7.7 | 16.2 | 42.1 | 0.0 | 72.7 | 0.27 | 50.3 | 42.1 |
 Darien Moore Jr. |
G | 1 | 12.0 | 7.0 | 1.0 | 1.0 | 2.0 | 1.0 | 1.0 | 3.0 | 8.0 | 6 | 1 | 6.0 | 20.6 | 100.0 | 100.0 | 0 | 0.16 | 116.7 | 116.7 |
 Mihailo Petrovic |
G | 3 | 15.3 | 5.7 | 1.7 | 3.0 | 1.0 | 0.0 | 0.7 | 3.3 | 7.3 | 24 | 3 | 8.0 | 20.7 | 60.0 | 33.3 | 100.0 | -0.12 | 72.3 | 65.0 |
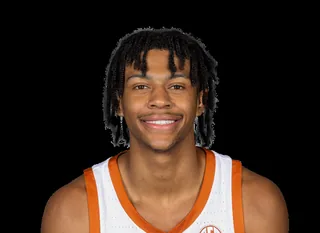 Simeon Wilcher |
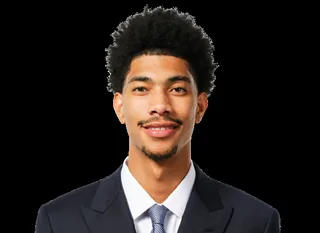
G | 3 | 26.7 | 5.3 | 4.7 | 1.0 | 1.0 | 0.0 | 1.7 | 6.0 | 4.3 | 19 | 3 | 6.3 | 9.5 | 27.8 | 18.2 | 66.7 | 1.51 | 38.8 | 33.3 |
 Rodney Brown Jr. |
G | 3 | 12.3 | 3.0 | 2.3 | 1.0 | 0.7 | 0.7 | 0.0 | 2.0 | 5.7 | 8 | 3 | 2.7 | 8.7 | 50.0 | 40.0 | 100.0 | -0.35 | 69.9 | 66.7 |
 Ilay Dolinski |
F | 2 | 3.5 | 3.0 | 1.0 | 0.0 | 0.0 | 0.0 | 0.5 | 1.5 | 2.0 | 3 | 2 | 1.5 | 18.3 | 66.7 | 0 | 100.0 | 0.03 | 77.3 | 66.7 |
 Trey Parker |
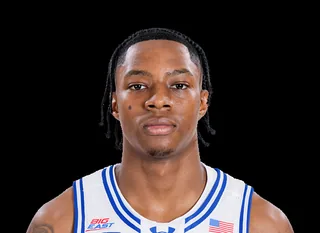
G | 3 | 16.7 | 3.0 | 1.7 | 1.7 | 1.0 | 0.0 | 1.7 | 3.7 | 2.0 | 20 | 3 | 6.7 | 16.0 | 27.3 | 20.0 | 100.0 | 0.7 | 37.9 | 31.8 |
 Kareem Thomas |
G | 3 | 7.7 | 2.3 | 0.3 | 0.0 | 0.0 | 0.0 | 0.0 | 1.3 | 1.3 | 7 | 3 | 2.3 | 12.6 | 50.0 | 33.3 | 50.0 | -0.36 | 60.8 | 62.5 |
 Mayar Wol |
F | 3 | 10.0 | 1.7 | 3.0 | 0.3 | 0.3 | 0.0 | 0.3 | 2.3 | 2.7 | 10 | 3 | 3.3 | 13.3 | 28.6 | 20.0 | 0 | -0.16 | 35.7 | 35.7 |
 Theo Airhienbuwa |
F | 1 | 3.0 | 1.0 | 1.0 | 0.0 | 0.0 | 0.0 | 0.0 | 0.0 | 2.0 | 1 | 1 | 1.0 | 12.7 | 0 | 0 | 50.0 | -0.17 | 56.8 | 0 |
 Abdulai Fanta Kabba |
C | 2 | 3.0 | 0.0 | 1.0 | 0.5 | 0.0 | 0.0 | 0.0 | 1.5 | 0.0 | -6 | 2 | -3.0 | -38.2 | 0.0 | 0 | 0 | -1.09 | 0.0 | 0.0 |
 Del Jones |
G | 3 | 14.0 | 0.0 | 1.3 | 1.7 | 0.3 | 0.3 | 1.7 | 2.0 | 0.0 | 1 | 3 | 0.3 | 1.0 | 0.0 | 0.0 | 0 | -0.9 | 0.0 | 0.0 |
Numbers/Game vs RAPM
X-axis = Numbers/Game (PTS+REB+AST+STL+BLK-TO-FGA), Y-axis = RAPM.
Advanced: Numbers = PTS+REB+AST+STL+BLK-TO-FGA, PM = total +/-, PM/G = per game, PM/40 = per 40 minutes, RAPM = Regularized Adj Plus-Minus, TS% = True Shooting, eFG% = Effective FG
Alumni in the Pros
Former Seton Hall players in NBA 2026-2027, EuroLeague 2026-2027, G League 2026-2027, EuroCup 2026-2027, matched by provider player ids (ESPN athlete ids, ESPN bios, linked StatsNBA/EuroLeague ids). Only games after their last Seton Hall game count. These are observed results, not certified complete seasons. League and team are where each player last played a regular-season or playoff game (NBA ahead of G League when he played in both); recent games include the preseason.
Active alumni
| Player | At School | League | Team | GP | MPG | PPG | RPG | APG | Last game | Last 30 days |
|---|---|---|---|---|---|---|---|---|---|---|
| Sandro Mamukelashvili | 2017-21 | NBA | Los Angeles Lakers | 12 | 23.4 | 9.8 | 4.6 | 1.6 | 11-09 23 pts, 8 reb, 3 ast | 12 GP, 9.8 PPG, 4.6 RPG, 1.6 APG |
| Jared Rhoden | 2018-22 | EuroLeague | Paris Basketball | 8 | 21.5 | 13.2 | 3.5 | 2.2 | 11-05 14 pts, 3 reb, 1 ast | 5 GP, 14.4 PPG, 2.8 RPG, 2.4 APG |
| Khadeen Carrington | 2014-18 | EuroLeague | Hapoel IBI Tel Aviv | 3 | 3.4 | 0.7 | 0.3 | 0.7 | 10-28 2 pts, 0 reb, 1 ast | 1 GP, 2.0 PPG, 0.0 RPG, 1.0 APG |
| Kadary Richmond | 2021-24 | G League | Cleveland Charge | 0 | - | - | - | - | 11-10 2 pts, 4 reb, 4 ast Play-In | 1 GP, 2.0 PPG, 4.0 RPG, 4.0 APG |
| Tyrese Samuel | 2019-23 | EuroCup | Cosea JL Bourg-en-Bresse | 7 | 16.2 | 9.0 | 4.3 | 0.6 | 11-10 7 pts, 2 reb, 0 ast | 4 GP, 9.2 PPG, 3.8 RPG, 0.5 APG |
Alumni around the leagues: recent games
| Date | Player | League | Team | Opponent | MIN | PTS | REB | AST | Box |
|---|---|---|---|---|---|---|---|---|---|
| 2026-11-10 | Tyrese Samuel | EuroCup | Cosea JL Bourg-en-Bresse | vs Buducnost VOLI Podgorica | 18 | 7 | 2 | 0 | Box |
| 2026-11-10 | Kadary Richmond | G League Play-In | Cleveland Charge | vs Motor City Cruise | 18 | 2 | 4 | 4 | Box |
| 2026-11-09 | Sandro Mamukelashvili | NBA | Los Angeles Lakers | @ Atlanta Hawks | 32 | 23 | 8 | 3 | Box |
| 2026-11-08 | Sandro Mamukelashvili | NBA | Los Angeles Lakers | @ Detroit Pistons | 18 | 7 | 3 | 0 | Box |
| 2026-11-06 | Sandro Mamukelashvili | NBA | Los Angeles Lakers | vs Portland Trail Blazers | 20 | 7 | 3 | 1 | Box |
| 2026-11-05 | Jared Rhoden | EuroLeague | Paris Basketball | @ Anadolu Efes Istanbul | 22 | 14 | 3 | 1 | Box |
| 2026-11-04 | Tyrese Samuel | EuroCup | Cosea JL Bourg-en-Bresse | @ Slask Wroclaw | 22 | 14 | 7 | 1 | Box |
| 2026-10-28 | Tyrese Samuel | EuroCup | Cosea JL Bourg-en-Bresse | @ NINERS Chemnitz | 19 | 16 | 5 | 1 | Box |
| 2026-10-28 | Khadeen Carrington | EuroLeague | Hapoel IBI Tel Aviv | vs Anadolu Efes Istanbul | 4 | 2 | 0 | 1 | Box |
| 2026-10-27 | Jared Rhoden | EuroLeague | Paris Basketball | @ Dubai Basketball | 28 | 20 | 3 | 3 | Box |
| 2026-10-23 | Jared Rhoden | EuroLeague | Paris Basketball | vs Valencia Basket | 24 | 20 | 4 | 4 | Box |
| 2026-10-01 | Khadeen Carrington | EuroLeague | Hapoel IBI Tel Aviv | vs Real Madrid | 6 | 0 | 1 | 1 | Box |
| 2026-09-29 | Khadeen Carrington | EuroLeague | Hapoel IBI Tel Aviv | @ Crvena Zvezda Meridianbet Belgrade | 1 | 0 | 0 | 0 | Box |
2026-2027 Shot Zones
151 located field-goal attempts in 3 games (ESPN). Each zone is coloured by the player with the largest share of the team's made-shot points there (left) and of its misses there (right).
Roddie Anderson IIITerry Copeland Jr.Devin WilliamsSimeon WilcherDarien Moore Jr.Kareem ThomasDel Jones
| Zone | FGM-FGA | FG% | Pts | Top scorer | Runner-up | Most misses | Runner-up |
|---|---|---|---|---|---|---|---|
| Restricted area | 25-36 | 69.4 | 50 | Devin Williams 20% (10 pts) | Terry Copeland Jr. 20% (10 pts) | Roddie Anderson III 27% (3 misses) | Abdulai Fanta Kabba 18% (2 misses) |
| Paint (non-RA) | 12-36 | 33.3 | 24 | Terry Copeland Jr. 33% (8 pts) | Devin Williams 17% (4 pts) | Roddie Anderson III 33% (8 misses) | Elijah Fisher 25% (6 misses) |
| Mid-range left | 0-2 | 0.0 | 0 | - | - | Del Jones 50% (1 misses) | Simeon Wilcher 50% (1 misses) |
| Mid-range center | 3-6 | 50.0 | 6 | Devin Williams 33% (2 pts) | Simeon Wilcher 33% (2 pts) | Del Jones 33% (1 misses) | Mihailo Petrovic 33% (1 misses) |
| Mid-range right | 3-11 | 27.3 | 6 | Darien Moore Jr. 33% (2 pts) | Mayar Wol 33% (2 pts) | Devin Williams 25% (2 misses) | Del Jones 12% (1 misses) |
| Left corner 3 | 3-5 | 60.0 | 9 | Simeon Wilcher 67% (6 pts) | Darien Moore Jr. 33% (3 pts) | Kareem Thomas 50% (1 misses) | Trey Parker 50% (1 misses) |
| Right corner 3 | 6-8 | 75.0 | 18 | Roddie Anderson III 50% (9 pts) | Kareem Thomas 17% (3 pts) | Simeon Wilcher 100% (2 misses) | - |
| Above-break 3 left | 5-10 | 50.0 | 15 | Roddie Anderson III 60% (9 pts) | Elijah Fisher 20% (3 pts) | Roddie Anderson III 40% (2 misses) | Elijah Fisher 20% (1 misses) |
| Above-break 3 center | 3-15 | 20.0 | 9 | Roddie Anderson III 67% (6 pts) | Rodney Brown Jr. 33% (3 pts) | Del Jones 17% (2 misses) | Devin Williams 17% (2 misses) |
| Above-break 3 right | 3-22 | 13.6 | 9 | Roddie Anderson III 67% (6 pts) | Trey Parker 33% (3 pts) | Simeon Wilcher 26% (5 misses) | Roddie Anderson III 21% (4 misses) |