 Rice
2026-2027 Team Stats (4 games)
Model Outputs
Output is shown as model rating with league rank in parentheses when available.
| Model | Output | Notes |
|---|---|---|
| Elo Elo Streaming paired-comparison rating with recency baked into sequential updates. More → | 1279 (#52) | Preseason prior 1198 (returning production + recruiting): last season 1137, returning +89, transfers -28, freshmen +0 |
| Bradley-Terry Bradley-Terry Static logistic paired-comparison model with one team strength parameter. More → | 1180 (#52) | HCA +169 elo |
| Bradley-Terry Recency Bradley-Terry Recency Static Bradley-Terry with exponential recency weights on newer games. More → | 1178 (#52) | HCA +169 elo |
| Margin Margin Linear team-strength model fit on point differential instead of binary wins. More → | +8.1 (#103) | HCA +1.7 |
| Margin Recency Margin Recency Margin regression with exponential recency weights on newer games. More → | +8.0 (#103) | HCA +1.6 |
| Pythagorean Pythagorean Pythagorean win expectation from raw points scored and allowed. More → | 0.931 (#52) | - |
| Adjusted Efficiency Adjusted Efficiency Opponent-adjusted efficiency model with separate offensive and defensive components. More → | 0.786 (#67) | AdjNet +13.1 |
| Log Adjusted Log Adjusted Log-scale adjusted efficiency model that downweights blowout leverage. More → | 0.781 (#71) | AdjNet +12.2 |
| Points Off/Def Points Off/Def Raw points regression with separate offensive and defensive team parameters. More → | 0.705 (#73) | AdjO 61.2 | AdjD 52.7 |
| Points Off/Def Recency Points Off/Def Recency Off/def points regression with exponential recency weights. More → | 0.703 (#73) | AdjO 61.2 | AdjD 52.8 |
| Core Ensemble Core Ensemble Equal-logit blend of Elo, recency BT, recency margin, log-adjusted pyth, and points off/def. More → | 0.747 (#74) | Blend of Elo, BT, Margin, PythLog, PtsOD |
| Recency Ensemble Recency Ensemble Equal-logit blend of Elo, recency BT, recency margin, log-adjusted pyth, and recency points off/def. More → | 0.747 (#74) | Blend of Elo, BT, Margin, PythLog, PtsOD |
| Dynamic Bradley-Terry Dynamic Bradley-Terry Time-evolving paired-comparison model with latent team strength drift. More → | 1206 (#49) | RD 172 | GP 4 |
| Adjusted Context Blend Adjusted Context Blend Chronologically trained component blend with rest and signed venue context. More → | 0.799 (#64) | Chronological component blend with rest and venue. |
Rank through the season
League rank each week from the model's fit of the games played by then, published the same way as the table above, so each line ends at the rank shown there. Select a point for its rating.
2026-2027 Schedule & Results
| Date | Vs/At | Opponent | Result | Score |
|---|---|---|---|---|
| 2026-11-02 | vs | Houston Christian Huskies | W | 72 - 34 |
| 2026-11-06 | @ | Murray State Racers | W | 69 - 64 |
| 2026-11-08 | @ | Richmond Spiders | W | 73 - 60 |
| 2026-11-12 | vs | Texas Southern Tigers | W | 71 - 46 |
| 2026-11-17 | @ | UNLV Lady Rebels | - | Preview |
2026-2027 Roster
Estimated Minutes by Position
Estimated from roster positions, box scores and minutes played. Each column totals one game's minutes, divided among the players. Use the labels or legend to highlight a player's estimated role.
| Player | Pos | GP | MIN | PTS | REB | AST | STL | BLK | TO | FGA | Numbers | PM | PM GP | PM/G | PM/40 | FG% | 3P% | FT% | RAPM | TS% | eFG% |
|---|---|---|---|---|---|---|---|---|---|---|---|---|---|---|---|---|---|---|---|---|---|
 Louann Battiston |
G | 4 | 35.2 | 15.8 | 2.8 | 6.0 | 1.5 | 0.2 | 2.0 | 11.2 | 13.0 | 76 | 4 | 19.0 | 21.5 | 46.7 | 52.6 | 100.0 | 1.81 | 63.2 | 57.8 |
 Victoria Flores |
G | 3 | 26.0 | 10.7 | 4.3 | 1.3 | 1.7 | 0.0 | 2.0 | 7.3 | 8.7 | 38 | 3 | 12.7 | 19.5 | 45.5 | 18.2 | 90.9 | 3.12 | 59.6 | 50.0 |
 Aniah Alexis |
G | 4 | 34.2 | 9.0 | 7.0 | 2.5 | 1.8 | 0.2 | 2.2 | 9.5 | 8.8 | 82 | 4 | 20.5 | 23.9 | 39.5 | 21.4 | 75.0 | 3.52 | 45.3 | 43.4 |
 Hailey Adams |
G | 4 | 33.5 | 8.5 | 12.0 | 4.2 | 1.0 | 1.0 | 2.0 | 6.2 | 18.5 | 75 | 4 | 18.8 | 22.4 | 52.0 | 66.7 | 54.5 | 3.36 | 57.0 | 56.0 |
 Jordin Blackmon |
G | 4 | 20.8 | 8.2 | 1.8 | 1.0 | 0.2 | 0.5 | 0.5 | 7.0 | 4.2 | 31 | 4 | 7.8 | 15.0 | 42.9 | 38.5 | 66.7 | -2.57 | 53.9 | 51.8 |
 Reychel Douglas |
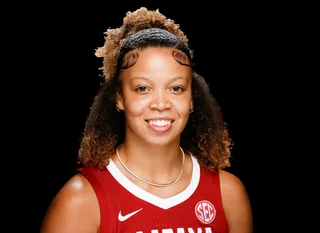
G | 4 | 13.8 | 8.0 | 3.2 | 0.5 | 0.2 | 0.0 | 1.2 | 5.5 | 5.2 | 17 | 4 | 4.2 | 12.6 | 59.1 | 0.0 | 66.7 | -3.52 | 61.6 | 59.1 |
 Lilly Taulelei |
C | 3 | 17.0 | 5.3 | 2.7 | 0.3 | 0.3 | 0.3 | 1.3 | 5.0 | 2.7 | 41 | 3 | 13.7 | 31.8 | 46.7 | 0 | 50.0 | 0.64 | 47.7 | 46.7 |
 Myah Hazelton |
C | 4 | 13.5 | 4.5 | 1.0 | 0.2 | 0.5 | 0.5 | 1.0 | 5.8 | 0.0 | 10 | 4 | 2.5 | 7.4 | 39.1 | 0 | 0 | -4.11 | 39.1 | 39.1 |
 Layla Conley |
G | 2 | 4.0 | 3.0 | 0.0 | 0.5 | 0.0 | 0.0 | 0.5 | 1.5 | 1.5 | 18 | 2 | 9.0 | 89.8 | 66.7 | 66.7 | 0 | 1.83 | 100.0 | 100.0 |
 Mylee Guinn |
G | 4 | 11.8 | 2.5 | 1.2 | 0.0 | 0.5 | 0.0 | 0.2 | 4.0 | 0.0 | 18 | 4 | 4.5 | 15.5 | 18.8 | 22.2 | 50.0 | -2.05 | 28.2 | 25.0 |
 Hanna Hilberth |
C | 2 | 7.5 | 1.5 | 1.5 | 0.0 | 0.0 | 0.0 | 0.5 | 1.5 | 1.0 | 4 | 2 | 2.0 | 10.7 | 33.3 | 33.3 | 0 | -1.4 | 50.0 | 50.0 |
 Kaylen Sta. Maria |
G | 3 | 3.7 | 0.7 | 0.0 | 0.0 | 0.0 | 0.0 | 0.3 | 1.0 | -0.7 | 1 | 3 | 0.3 | 3.5 | 33.3 | 0.0 | 0 | -1.03 | 33.3 | 33.3 |
 Pace Rickard |
G | 2 | 5.5 | 0.0 | 0.0 | 0.5 | 0.0 | 0.0 | 0.5 | 0.5 | -0.5 | -6 | 2 | -3.0 | -21.0 | 0.0 | 0.0 | 0 | -2.95 | 0.0 | 0.0 |
 Paige Cofer |
F | 0 | - | 0.0 | 0.0 | 0.0 | - | - | - | - | - | - | - | - | - | - | - | - | - | - | - |
Numbers/Game vs RAPM
X-axis = Numbers/Game (PTS+REB+AST+STL+BLK-TO-FGA), Y-axis = RAPM.
Advanced: Numbers = PTS+REB+AST+STL+BLK-TO-FGA, PM = total +/-, PM/G = per game, PM/40 = per 40 minutes, RAPM = Regularized Adj Plus-Minus, TS% = True Shooting, eFG% = Effective FG
2026-2027 Shot Zones
244 located field-goal attempts in 4 games (ESPN). Each zone is coloured by the player with the largest share of the team's made-shot points there (left) and of its misses there (right).
Louann BattistonAniah AlexisJordin BlackmonHailey AdamsReychel DouglasVictoria FloresMyah HazeltonLilly TauleleiMylee Guinn
| Zone | FGM-FGA | FG% | Pts | Top scorer | Runner-up | Most misses | Runner-up |
|---|---|---|---|---|---|---|---|
| Restricted area | 41-65 | 63.1 | 82 | Reychel Douglas 22% (18 pts) | Aniah Alexis 15% (12 pts) | Lilly Taulelei 25% (6 misses) | Aniah Alexis 12% (3 misses) |
| Paint (non-RA) | 21-51 | 41.2 | 42 | Hailey Adams 33% (14 pts) | Aniah Alexis 14% (6 pts) | Myah Hazelton 23% (7 misses) | Hailey Adams 17% (5 misses) |
| Mid-range left | 5-16 | 31.2 | 10 | Victoria Flores 40% (4 pts) | Aniah Alexis 20% (2 pts) | Louann Battiston 36% (4 misses) | Jordin Blackmon 18% (2 misses) |
| Mid-range center | 9-15 | 60.0 | 18 | Louann Battiston 44% (8 pts) | Jordin Blackmon 22% (4 pts) | Louann Battiston 33% (2 misses) | Hailey Adams 17% (1 misses) |
| Mid-range right | 4-16 | 25.0 | 8 | Aniah Alexis 50% (4 pts) | Jordin Blackmon 25% (2 pts) | Aniah Alexis 33% (4 misses) | Hailey Adams 17% (2 misses) |
| Left corner 3 | 3-11 | 27.3 | 9 | Aniah Alexis 33% (3 pts) | Jordin Blackmon 33% (3 pts) | Mylee Guinn 38% (3 misses) | Aniah Alexis 25% (2 misses) |
| Right corner 3 | 2-4 | 50.0 | 6 | Aniah Alexis 50% (3 pts) | Layla Conley 50% (3 pts) | Jordin Blackmon 50% (1 misses) | Pace Rickard 50% (1 misses) |
| Above-break 3 left | 9-26 | 34.6 | 27 | Louann Battiston 44% (12 pts) | Jordin Blackmon 22% (6 pts) | Jordin Blackmon 24% (4 misses) | Mylee Guinn 18% (3 misses) |
| Above-break 3 center | 6-15 | 40.0 | 18 | Louann Battiston 50% (9 pts) | Hailey Adams 33% (6 pts) | Aniah Alexis 33% (3 misses) | Hailey Adams 11% (1 misses) |
| Above-break 3 right | 7-25 | 28.0 | 21 | Louann Battiston 43% (9 pts) | Jordin Blackmon 29% (6 pts) | Louann Battiston 39% (7 misses) | Aniah Alexis 22% (4 misses) |