 Philadelphia 76ers
2024 Team Stats (89 games)
Model Outputs
Output is shown as model rating with league rank in parentheses when available.
| Model | Output | Notes |
|---|---|---|
| Elo Elo Streaming paired-comparison rating with recency baked into sequential updates. More → | 1129 (#6) | - |
| Bradley-Terry Bradley-Terry Static logistic paired-comparison model with one team strength parameter. More → | 1042 (#16) | - |
| Bradley-Terry Recency Bradley-Terry Recency Static Bradley-Terry with exponential recency weights on newer games. More → | 1021 (#11) | HCA +29 elo |
| Margin Margin Linear team-strength model fit on point differential instead of binary wins. More → | +2.5 (#11) | HCA +2.3 |
| Margin Recency Margin Recency Margin regression with exponential recency weights on newer games. More → | +2.0 (#13) | HCA +2.8 |
| Pythagorean Pythagorean Pythagorean win expectation from raw points scored and allowed. More → | 0.571 (#7) | - |
| Adjusted Efficiency Adjusted Efficiency Opponent-adjusted efficiency model with separate offensive and defensive components. More → | 0.563 (#13) | AdjNet +2.2 |
| Log Adjusted Log Adjusted Log-scale adjusted efficiency model that downweights blowout leverage. More → | 0.563 (#13) | AdjNet +2.2 |
| Points Off/Def Points Off/Def Raw points regression with separate offensive and defensive team parameters. More → | 0.557 (#11) | AdjO 113.1 | AdjD 110.6 |
| Points Off/Def Recency Points Off/Def Recency Off/def points regression with exponential recency weights. More → | 0.539 (#13) | AdjO 110.3 | AdjD 108.6 |
| Core Ensemble Core Ensemble Equal-logit blend of Elo, recency BT, recency margin, log-adjusted pyth, and points off/def. More → | 0.580 (#9) | Blend of Elo, BT, Margin, PythLog, PtsOD |
| Recency Ensemble Recency Ensemble Equal-logit blend of Elo, recency BT, recency margin, log-adjusted pyth, and recency points off/def. More → | 0.576 (#11) | Blend of Elo, BT, Margin, PythLog, PtsOD |
| Dynamic Bradley-Terry Dynamic Bradley-Terry Time-evolving paired-comparison model with latent team strength drift. More → | 1043 (#13) | RD 193 | GP 89 |
2024 Schedule & Results
| Date | Vs/At | Opponent | Result | Score |
|---|---|---|---|---|
| 2023-10-26 | @ | Milwaukee Bucks | L | 117 - 118 |
| 2023-10-28 | @ | Toronto Raptors | W | 114 - 107 |
| 2023-10-29 | vs | Portland Trail Blazers | W | 126 - 98 |
| 2023-11-02 | vs | Toronto Raptors | W | 114 - 99 |
| 2023-11-04 | vs | Phoenix Suns | W | 112 - 100 |
| 2023-11-06 | vs | Washington Wizards | W | 146 - 128 |
| 2023-11-08 | vs | Boston Celtics | W | 106 - 103 |
| 2023-11-10 | @ | Detroit Pistons | W | 114 - 106 |
| 2023-11-12 | vs | Indiana Pacers | W | 137 - 126 |
| 2023-11-14 | vs | Indiana Pacers | L | 126 - 132 |
| 2023-11-15 | vs | Boston Celtics | L | 107 - 117 |
| 2023-11-17 | @ | Atlanta Hawks | W | 126 - 116 |
| 2023-11-19 | @ | Brooklyn Nets | W | 121 - 99 |
| 2023-11-21 | vs | Cleveland Cavaliers | L | 119 - 122 |
| 2023-11-22 | @ | Minnesota Timberwolves | L | 99 - 112 |
| 2023-11-25 | @ | Oklahoma City Thunder | W | 127 - 123 |
| 2023-11-27 | vs | Los Angeles Lakers | W | 138 - 94 |
| 2023-11-29 | @ | New Orleans Pelicans | L | 114 - 124 |
| 2023-12-01 | @ | Boston Celtics | L | 119 - 125 |
| 2023-12-06 | @ | Washington Wizards | W | 131 - 126 |
| 2023-12-08 | vs | Atlanta Hawks | W | 125 - 114 |
| 2023-12-11 | vs | Washington Wizards | W | 146 - 101 |
| 2023-12-13 | @ | Detroit Pistons | W | 129 - 111 |
| 2023-12-15 | vs | Detroit Pistons | W | 124 - 92 |
| 2023-12-16 | @ | Charlotte Hornets | W | 135 - 82 |
| 2023-12-18 | vs | Chicago Bulls | L | 104 - 108 |
| 2023-12-20 | vs | Minnesota Timberwolves | W | 127 - 113 |
| 2023-12-22 | vs | Toronto Raptors | W | 121 - 111 |
| 2023-12-25 | @ | Miami Heat | L | 113 - 119 |
| 2023-12-27 | @ | Orlando Magic | W | 112 - 92 |
| 2023-12-29 | @ | Houston Rockets | W | 131 - 127 |
| 2023-12-30 | @ | Chicago Bulls | L | 92 - 105 |
| 2024-01-02 | vs | Chicago Bulls | W | 110 - 97 |
| 2024-01-05 | vs | New York Knicks | L | 92 - 128 |
| 2024-01-06 | vs | Utah Jazz | L | 109 - 120 |
| 2024-01-10 | @ | Atlanta Hawks | L | 132 - 139 |
| 2024-01-12 | vs | Sacramento Kings | W | 112 - 93 |
| 2024-01-15 | vs | Houston Rockets | W | 124 - 115 |
| 2024-01-16 | vs | Denver Nuggets | W | 126 - 121 |
| 2024-01-19 | @ | Orlando Magic | W | 124 - 109 |
| 2024-01-20 | @ | Charlotte Hornets | W | 97 - 89 |
| 2024-01-22 | vs | San Antonio Spurs | W | 133 - 123 |
| 2024-01-25 | @ | Indiana Pacers | L | 122 - 134 |
| 2024-01-27 | @ | Denver Nuggets | L | 105 - 111 |
| 2024-01-29 | @ | Portland Trail Blazers | L | 104 - 130 |
| 2024-01-30 | @ | Golden State Warriors | L | 107 - 119 |
| 2024-02-01 | @ | Utah Jazz | W | 127 - 124 |
| 2024-02-03 | vs | Brooklyn Nets | L | 121 - 136 |
| 2024-02-05 | vs | Dallas Mavericks | L | 102 - 118 |
| 2024-02-07 | vs | Golden State Warriors | L | 104 - 127 |
| 2024-02-09 | vs | Atlanta Hawks | L | 121 - 127 |
| 2024-02-10 | @ | Washington Wizards | W | 119 - 113 |
| 2024-02-12 | @ | Cleveland Cavaliers | W | 123 - 121 |
| 2024-02-14 | vs | Miami Heat | L | 104 - 109 |
| 2024-02-22 | vs | New York Knicks | L | 96 - 110 |
| 2024-02-23 | vs | Cleveland Cavaliers | W | 104 - 97 |
| 2024-02-25 | vs | Milwaukee Bucks | L | 98 - 119 |
| 2024-02-27 | @ | Boston Celtics | L | 99 - 117 |
| 2024-03-01 | vs | Charlotte Hornets | W | 121 - 114 |
| 2024-03-03 | @ | Dallas Mavericks | W | 120 - 116 |
| 2024-03-05 | @ | Brooklyn Nets | L | 107 - 112 |
| 2024-03-06 | vs | Memphis Grizzlies | L | 109 - 115 |
| 2024-03-08 | vs | New Orleans Pelicans | L | 95 - 103 |
| 2024-03-10 | @ | New York Knicks | W | 79 - 73 |
| 2024-03-12 | @ | New York Knicks | L | 79 - 106 |
| 2024-03-14 | @ | Milwaukee Bucks | L | 105 - 114 |
| 2024-03-16 | vs | Charlotte Hornets | W | 109 - 98 |
| 2024-03-18 | vs | Miami Heat | W | 98 - 91 |
| 2024-03-20 | @ | Phoenix Suns | L | 102 - 115 |
| 2024-03-22 | @ | Los Angeles Lakers | L | 94 - 101 |
| 2024-03-24 | @ | LA Clippers | W | 121 - 107 |
| 2024-03-25 | @ | Sacramento Kings | L | 96 - 108 |
| 2024-03-27 | vs | LA Clippers | L | 107 - 108 |
| 2024-03-29 | @ | Cleveland Cavaliers | L | 114 - 117 |
| 2024-03-31 | @ | Toronto Raptors | W | 135 - 120 |
| 2024-04-02 | vs | Oklahoma City Thunder | W | 109 - 105 |
| 2024-04-04 | @ | Miami Heat | W | 109 - 105 |
| 2024-04-06 | @ | Memphis Grizzlies | W | 116 - 96 |
| 2024-04-07 | @ | San Antonio Spurs | W | 133 - 126 |
| 2024-04-09 | vs | Detroit Pistons | W | 120 - 102 |
| 2024-04-12 | vs | Orlando Magic | W | 125 - 113 |
| 2024-04-14 | vs | Brooklyn Nets | W | 107 - 86 |
| 2024-04-17 | vs | Miami Heat | W | 105 - 104 |
| 2024-04-20 | @ | New York Knicks | L | 104 - 111 |
| 2024-04-22 | @ | New York Knicks | L | 101 - 104 |
| 2024-04-25 | vs | New York Knicks | W | 125 - 114 |
| 2024-04-28 | vs | New York Knicks | L | 92 - 97 |
| 2024-04-30 | @ | New York Knicks | W | 112 - 106 |
| 2024-05-02 | vs | New York Knicks | L | 115 - 118 |
2024 Roster
Minutes by Position
Each player's share of the team's minutes per game (season minutes over the roster's), placed by position, so every column is one game's minutes. Use the labels or legend to isolate how each player absorbs guard-to-big minutes.
| Player | Pos | GP | MIN | PTS | REB | AST | STL | BLK | TO | FGA | Numbers | PM | PM GP | PM/G | PM/40 | FG% | 3P% | FT% | RAPM | TS% | eFG% |
|---|---|---|---|---|---|---|---|---|---|---|---|---|---|---|---|---|---|---|---|---|---|
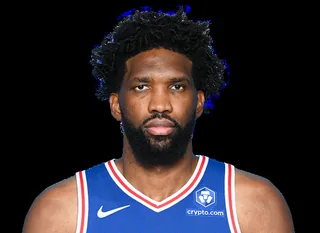 Joel Embiid |
C | 47 | 34.7 | 33.9 | 11.0 | 5.5 | 1.2 | 1.6 | 3.9 | 21.6 | 27.8 | 263 | 39 | 6.7 | 8.1 | 51.1 | 37.8 | 88.1 | 2.37 | 63.4 | 54.6 |
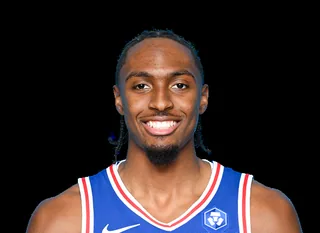 Tyrese Maxey |
G | 78 | 38.0 | 26.0 | 3.8 | 6.3 | 1.0 | 0.5 | 1.7 | 20.3 | 15.5 | 296 | 70 | 4.2 | 4.5 | 45.1 | 37.3 | 87.0 | 1.86 | 57.4 | 52.7 |
 Tobias Harris |
F | 78 | 33.9 | 16.4 | 6.6 | 3.0 | 0.9 | 0.6 | 1.3 | 13.1 | 13.1 | 215 | 70 | 3.1 | 3.6 | 48.3 | 34.6 | 87.3 | 0.67 | 57.1 | 53.1 |
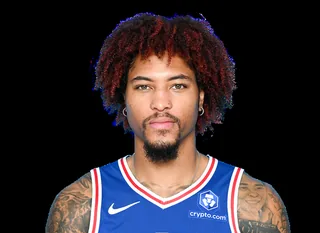 Kelly Oubre Jr. |
G | 76 | 30.9 | 15.1 | 4.9 | 1.5 | 1.2 | 0.7 | 1.3 | 12.6 | 9.6 | 8 | 68 | 0.1 | 0.2 | 44.3 | 31.2 | 75.1 | -0.58 | 53.7 | 50.0 |
 Buddy Hield |
G | 37 | 24.2 | 11.3 | 2.9 | 2.8 | 0.7 | 0.3 | 1.2 | 9.7 | 7.2 | 61 | 84 | 0.7 | 1.1 | 42.5 | 38.9 | 92.9 | -0.26 | 56.6 | 54.9 |
 De'Anthony Melton |
G | 40 | 26.4 | 11.2 | 3.7 | 2.9 | 1.6 | 0.4 | 1.0 | 9.4 | 9.3 | 206 | 38 | 5.4 | 8.1 | 39.7 | 36.7 | 82.7 | 1.44 | 54.4 | 50.7 |
 Cameron Payne |
PG | 37 | 18.1 | 8.6 | 1.6 | 2.8 | 0.6 | 0.3 | 1.0 | 7.7 | 5.2 | 14 | 78 | 0.2 | 0.4 | 41.4 | 39.4 | 91.3 | -0.84 | 53.9 | 52.1 |
 Kyle Lowry |
Guard | 30 | 28.6 | 7.8 | 3.0 | 4.4 | 0.9 | 0.3 | 1.3 | 5.9 | 9.3 | -22 | 60 | -0.4 | -0.5 | 41.8 | 38.1 | 83.3 | -0.77 | 58.8 | 54.5 |
 Paul Reed |
F | 90 | 18.5 | 6.9 | 5.7 | 1.3 | 0.8 | 1.0 | 0.8 | 5.5 | 9.3 | 112 | 82 | 1.4 | 2.8 | 54.2 | 36.8 | 71.3 | 0.29 | 58.1 | 56.4 |
 Marcus Morris Sr. |
F | 37 | 17.2 | 6.7 | 2.9 | 0.7 | 0.4 | 0.3 | 0.5 | 5.5 | 4.9 | -62 | 49 | -1.3 | -3.0 | 43.9 | 40.0 | 86.1 | -0.87 | 55.9 | 52.7 |
 Patrick Beverley |
PG | 48 | 19.3 | 6.2 | 3.0 | 3.0 | 0.5 | 0.4 | 1.1 | 5.1 | 7.0 | -28 | 73 | -0.4 | -0.8 | 43.6 | 32.7 | 81.0 | -0.72 | 55.2 | 51.0 |
 Nicolas Batum |
Not Available | 64 | 26.1 | 5.8 | 4.4 | 2.0 | 0.7 | 0.6 | 0.7 | 4.5 | 8.3 | 164 | 59 | 2.8 | 4.3 | 45.7 | 41.0 | 69.0 | 0.48 | 61.3 | 60.6 |
 Ricky Council IV |
G | 32 | 9.0 | 5.4 | 1.4 | 0.5 | 0.2 | 0.0 | 0.2 | 3.5 | 4.0 | - | - | - | - | 48.2 | 37.5 | 74.6 | - | 60.4 | 53.6 |
 D.J. Wilson |
F | 2 | 8.0 | 5.0 | 1.0 | 1.0 | 0.0 | 1.0 | 0.0 | 3.0 | 5.0 | - | - | - | - | 66.7 | 100.0 | 0 | -0.27 | 83.3 | 83.3 |
 Robert Covington |
PF | 26 | 16.1 | 4.5 | 3.4 | 0.7 | 1.3 | 0.6 | 0.4 | 3.4 | 6.7 | 104 | 29 | 3.6 | 8.5 | 44.9 | 35.4 | 87.5 | 0.79 | 59.3 | 54.5 |
 Mo Bamba |
C | 57 | 13.0 | 4.4 | 4.2 | 0.7 | 0.4 | 1.1 | 0.7 | 3.5 | 6.6 | -41 | 57 | -0.7 | -2.2 | 49.0 | 39.1 | 68.0 | -1.06 | 57.5 | 55.3 |
 Jeff Dowtin Jr. |
G | 12 | 11.8 | 4.3 | 1.7 | 2.2 | 0.6 | 0.1 | 0.4 | 3.0 | 5.5 | 20 | 12 | 1.7 | 5.6 | 55.6 | 47.4 | 75.0 | -0.04 | 68.9 | 68.1 |
 Danuel House Jr. |
SF | 35 | 14.9 | 4.2 | 1.7 | 0.9 | 0.4 | 0.1 | 0.5 | 3.1 | 3.7 | 23 | 34 | 0.7 | 1.8 | 44.4 | 28.8 | 76.1 | 0.2 | 56.9 | 51.4 |
 Jaden Springer |
G | 33 | 11.8 | 4.1 | 1.8 | 1.1 | 0.8 | 0.3 | 0.8 | 3.6 | 3.7 | -3 | 49 | -0.1 | -0.2 | 40.0 | 25.6 | 82.4 | -0.97 | 49.6 | 44.2 |
 Martin Jr. |
F | 58 | 12.3 | 3.7 | 2.2 | 0.9 | 0.3 | 0.2 | 0.5 | 2.9 | 3.8 | 21 | 60 | 0.3 | 1.1 | 54.4 | 30.4 | 53.8 | -0.09 | 56.9 | 56.4 |
 Terquavion Smith |
G | 16 | 5.2 | 3.2 | 0.2 | 0.8 | 0.5 | 0.0 | 0.4 | 2.9 | 1.4 | - | - | - | - | 39.1 | 37.1 | 60.0 | - | 53.9 | 53.3 |
 Furkan Korkmaz |
SG | 36 | 8.9 | 2.7 | 0.9 | 0.8 | 0.4 | 0.1 | 0.3 | 2.3 | 2.2 | 33 | 35 | 0.9 | 4.4 | 40.2 | 35.7 | 68.2 | 0.11 | 52.4 | 49.4 |
 P.J. Tucker |
Power Forward | 4 | 21.5 | 1.5 | 5.0 | 0.2 | 1.0 | 0.5 | 0.8 | 1.8 | 5.8 | -12 | 31 | -0.4 | -1.0 | 28.6 | 28.6 | 0 | -1.21 | 42.9 | 42.9 |
 Javonte Smart |
G | 2 | 3.5 | 1.5 | 0.5 | 0.5 | 0.5 | 0.0 | 0.5 | 1.0 | 1.5 | - | - | - | - | 50.0 | 100.0 | 0 | -0.37 | 75.0 | 75.0 |
 Danny Green |
F | 3 | 8.3 | 1.0 | 0.7 | 0.3 | 0.3 | 0.0 | 0.3 | 1.0 | 1.0 | - | - | - | - | 33.3 | 50.0 | 0 | -0.39 | 50.0 | 50.0 |
 Kenneth Lofton Jr. |
F | 2 | 4.5 | 1.0 | 1.5 | 0.0 | 0.0 | 0.0 | 1.0 | 3.0 | -1.5 | - | - | - | - | 16.7 | 0.0 | 0 | - | 16.7 | 16.7 |
 F. Petrusev |
- | 1 | 3.0 | 0.0 | 1.0 | 0.0 | 0.0 | 0.0 | 0.0 | 0.0 | 1.0 | - | - | - | - | 0 | 0 | 0 | - | 0 | 0 |
 Darius Bazley |
PF | 3 | 3.0 | 0.0 | 0.3 | 0.7 | 0.0 | 0.0 | 0.3 | 0.3 | 0.3 | -30 | 9 | -3.3 | -7.9 | 0.0 | 0 | 0 | -0.56 | 0.0 | 0.0 |
Numbers/Game vs RAPM
X-axis = Numbers/Game (PTS+REB+AST+STL+BLK-TO-FGA), Y-axis = RAPM.
Advanced: Numbers = PTS+REB+AST+STL+BLK-TO-FGA, PM = total +/-, PM/G = per game, PM/40 = per 40 minutes, RAPM = Regularized Adj Plus-Minus, TS% = True Shooting, eFG% = Effective FG
2023-2024 Shot Zones
7323 located field-goal attempts in 82 games (NBA Stats). Each zone is coloured by the player with the largest share of the team's made-shot points there (left) and of its misses there (right).
Tyrese MaxeyTobias HarrisJoel EmbiidKelly Oubre Jr.Nicolas Batum
| Zone | FGM-FGA | FG% | Pts | Top scorer | Runner-up | Most misses | Runner-up |
|---|---|---|---|---|---|---|---|
| Restricted area | 1450-2297 | 63.1 | 2900 | Tyrese Maxey 17% (500 pts) | Kelly Oubre Jr. 14% (414 pts) | Tyrese Maxey 17% (143 misses) | Kelly Oubre Jr. 14% (121 misses) |
| Paint (non-RA) | 612-1461 | 41.9 | 1224 | Tyrese Maxey 20% (248 pts) | Tobias Harris 19% (234 pts) | Tyrese Maxey 22% (185 misses) | Tobias Harris 16% (138 misses) |
| Mid-range left | 113-264 | 42.8 | 226 | Joel Embiid 31% (70 pts) | Tobias Harris 24% (54 pts) | Joel Embiid 25% (37 misses) | Tobias Harris 22% (33 misses) |
| Mid-range center | 121-256 | 47.3 | 242 | Joel Embiid 53% (128 pts) | Tobias Harris 10% (24 pts) | Joel Embiid 38% (51 misses) | Tyrese Maxey 19% (25 misses) |
| Mid-range right | 116-320 | 36.2 | 232 | Tyrese Maxey 28% (66 pts) | Joel Embiid 21% (48 pts) | Tyrese Maxey 24% (49 misses) | Joel Embiid 22% (45 misses) |
| Left corner 3 | 122-315 | 38.7 | 366 | Nicolas Batum 19% (69 pts) | Kelly Oubre Jr. 15% (54 pts) | Kelly Oubre Jr. 14% (27 misses) | Nicolas Batum 14% (27 misses) |
| Right corner 3 | 124-305 | 40.7 | 372 | Tobias Harris 16% (60 pts) | Nicolas Batum 15% (57 pts) | Kelly Oubre Jr. 25% (45 misses) | Nicolas Batum 17% (30 misses) |
| Above-break 3 left | 274-759 | 36.1 | 822 | Tyrese Maxey 24% (201 pts) | Kelly Oubre Jr. 12% (96 pts) | Tyrese Maxey 26% (125 misses) | Buddy Hield 11% (51 misses) |
| Above-break 3 center | 232-640 | 36.2 | 696 | Tyrese Maxey 23% (162 pts) | Joel Embiid 11% (78 pts) | Tyrese Maxey 26% (107 misses) | Joel Embiid 11% (44 misses) |
| Above-break 3 right | 240-706 | 34.0 | 720 | Tyrese Maxey 28% (198 pts) | Cameron Payne 9% (66 pts) | Tyrese Maxey 22% (102 misses) | Kelly Oubre Jr. 12% (58 misses) |