 Indiana Pacers
2026-2027 Team Stats (13 games)
Model Outputs
Output is shown as model rating with league rank in parentheses when available.
| Model | Output | Notes |
|---|---|---|
| Elo Elo Streaming paired-comparison rating with recency baked into sequential updates. More → | 895 (#23) | - |
| Bradley-Terry Bradley-Terry Static logistic paired-comparison model with one team strength parameter. More → | 896 (#23) | HCA +23 elo |
| Bradley-Terry Recency Bradley-Terry Recency Static Bradley-Terry with exponential recency weights on newer games. More → | 919 (#23) | HCA +27 elo |
| Margin Margin Linear team-strength model fit on point differential instead of binary wins. More → | -5.5 (#22) | HCA +1.9 |
| Margin Recency Margin Recency Margin regression with exponential recency weights on newer games. More → | -5.8 (#22) | HCA +2.1 |
| Pythagorean Pythagorean Pythagorean win expectation from raw points scored and allowed. More → | 0.424 (#19) | - |
| Points Off/Def Points Off/Def Raw points regression with separate offensive and defensive team parameters. More → | 0.388 (#22) | AdjO 108.7 | AdjD 112.8 |
| Points Off/Def Recency Points Off/Def Recency Off/def points regression with exponential recency weights. More → | 0.390 (#22) | AdjO 108.7 | AdjD 112.4 |
| Dynamic Bradley-Terry Dynamic Bradley-Terry Time-evolving paired-comparison model with latent team strength drift. More → | 872 (#24) | RD 110 | GP 13 |
Rank through the season
League rank each week from the model's fit of the games played by then, published the same way as the table above, so each line ends at the rank shown there. Select a point for its rating.
2026-2027 Schedule & Results
| Date | Vs/At | Opponent | Result | Score |
|---|---|---|---|---|
| 2026-10-21 | @ | New Orleans Pelicans | W | 123 - 120 |
| 2026-10-23 | vs | Dallas Mavericks | L | 105 - 121 |
| 2026-10-25 | @ | Brooklyn Nets | W | 136 - 109 |
| 2026-10-26 | @ | Milwaukee Bucks | L | 102 - 110 |
| 2026-10-28 | vs | Philadelphia 76ers | L | 109 - 114 |
| 2026-10-30 | @ | Miami Heat | L | 125 - 145 |
| 2026-11-01 | vs | Brooklyn Nets | L | 90 - 98 |
| 2026-11-02 | vs | Atlanta Hawks | L | 104 - 108 |
| 2026-11-04 | @ | Memphis Grizzlies | W | 107 - 103 |
| 2026-11-07 | vs | Denver Nuggets | L | 102 - 114 |
| 2026-11-09 | @ | Dallas Mavericks | L | 122 - 125 |
| 2026-11-11 | vs | Washington Wizards | W | 114 - 101 |
| 2026-11-13 | vs | New York Knicks | W | 106 - 104 |
| 2026-11-15 | @ | Philadelphia 76ers | - | Preview |
| 2026-11-18 | vs | Houston Rockets | - | Preview |
| 2026-11-20 | @ | Cleveland Cavaliers | - | Preview |
2026-2027 Roster
Estimated Minutes by Position
Estimated from roster positions, box scores and minutes played. Each column totals one game's minutes, divided among the players. Use the labels or legend to highlight a player's estimated role.
| Player | Pos | GP | MIN | PTS | REB | AST | STL | BLK | TO | FGA | Numbers | PM | PM GP | PM/G | PM/40 | FG% | 3P% | FT% | RAPM | TS% | eFG% |
|---|---|---|---|---|---|---|---|---|---|---|---|---|---|---|---|---|---|---|---|---|---|
 Pascal Siakam |
F | 12 | 32.2 | 22.4 | 6.5 | 4.2 | 0.9 | 0.1 | 2.2 | 16.1 | 15.8 | -7 | 12 | -0.6 | -0.7 | 50.3 | 35.6 | 71.1 | 0.64 | 59.4 | 55.7 |
 Tyrese Haliburton |
G | 4 | 33.0 | 21.8 | 4.5 | 9.5 | 1.2 | 0.8 | 2.2 | 15.5 | 20.0 | 17 | 4 | 4.2 | 5.1 | 51.6 | 37.0 | 86.7 | -0.12 | 63.4 | 59.7 |
 Andrew Nembhard |
G | 11 | 33.4 | 16.6 | 2.3 | 7.7 | 0.5 | 0.2 | 2.5 | 12.6 | 12.1 | -4 | 11 | -0.4 | -0.4 | 44.6 | 40.3 | 89.5 | -0.71 | 58.8 | 53.6 |
 Obi Toppin |
F | 10 | 20.7 | 12.4 | 4.6 | 1.5 | 0.2 | 0.2 | 0.8 | 9.0 | 9.1 | -5 | 10 | -0.5 | -1.0 | 52.2 | 37.0 | 72.2 | -0.52 | 63.3 | 61.7 |
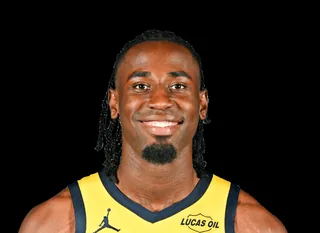 Aaron Nesmith |
G | 11 | 25.8 | 12.3 | 2.7 | 1.6 | 0.7 | 0.3 | 1.5 | 10.3 | 5.9 | -59 | 11 | -5.4 | -8.3 | 39.8 | 31.7 | 80.6 | -1.05 | 53.3 | 48.7 |
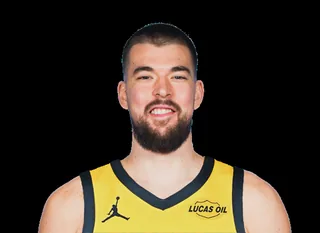 Ivica Zubac |
C | 8 | 23.5 | 10.8 | 8.9 | 1.6 | 0.0 | 0.8 | 1.6 | 8.0 | 12.4 | -15 | 8 | -1.9 | -3.2 | 56.2 | 0 | 70.0 | -0.29 | 59.1 | 56.2 |
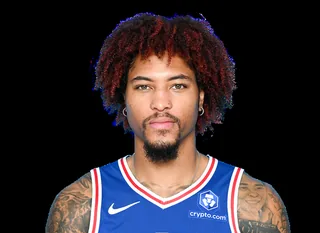 Kelly Oubre Jr. |
G | 11 | 24.2 | 10.2 | 2.9 | 1.3 | 0.7 | 0.8 | 0.6 | 8.9 | 6.4 | -44 | 11 | -4.0 | -6.7 | 43.9 | 21.4 | 73.9 | -1.37 | 51.8 | 48.5 |
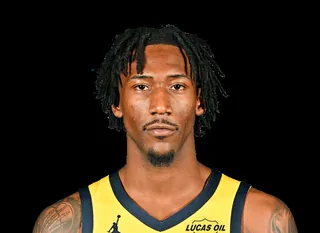 Quenton Jackson |
G | 13 | 21.5 | 9.0 | 3.6 | 2.7 | 1.3 | 0.2 | 1.2 | 6.8 | 8.8 | 38 | 13 | 2.9 | 5.4 | 46.6 | 35.9 | 87.5 | 0.39 | 59.4 | 54.5 |
 Jay Huff |
C | 11 | 16.7 | 7.1 | 3.5 | 0.8 | 0.1 | 0.7 | 0.7 | 5.2 | 6.4 | -24 | 11 | -2.2 | -5.2 | 50.9 | 30.3 | 83.3 | -1.42 | 62.6 | 59.6 |
 Jarace Walker |
F | 12 | 21.1 | 6.8 | 5.3 | 1.7 | 0.5 | 0.5 | 1.4 | 6.7 | 6.8 | -36 | 12 | -3.0 | -5.7 | 36.2 | 30.2 | 57.9 | -2.6 | 46.4 | 44.4 |
 T.J. McConnell |
G | 4 | 12.0 | 5.2 | 2.0 | 4.5 | 1.0 | 0.2 | 1.8 | 5.5 | 5.8 | -3 | 4 | -0.8 | -2.5 | 45.5 | 0.0 | 100.0 | -0.88 | 46.8 | 45.5 |
 Kobe Brown |
G | 6 | 13.5 | 4.7 | 2.3 | 1.0 | 0.2 | 0.0 | 0.5 | 3.8 | 3.8 | -7 | 6 | -1.2 | -3.4 | 43.5 | 25.0 | 83.3 | -1.63 | 54.6 | 50.0 |
 Larry Nance Jr. |
F | 12 | 14.5 | 4.4 | 2.5 | 0.6 | 0.9 | 0.2 | 0.6 | 3.4 | 4.6 | -6 | 12 | -0.5 | -1.4 | 46.3 | 39.3 | 57.1 | -0.62 | 60.1 | 59.8 |
 Braden Smith |
- | 8 | 13.2 | 3.8 | 0.6 | 2.4 | 1.0 | 0.4 | 1.0 | 3.6 | 3.5 | - | - | - | - | 44.8 | 28.6 | 50.0 | - | 48.8 | 48.3 |
 Jalen Slawson |
- | 11 | 14.2 | 3.4 | 3.2 | 1.0 | 0.8 | 0.6 | 0.9 | 2.4 | 5.7 | 31 | 11 | 2.8 | 7.9 | 42.3 | 20.0 | 68.4 | 0.51 | 53.8 | 46.2 |
 Ben Sheppard |
G | 1 | 12.0 | 3.0 | 1.0 | 0.0 | 0.0 | 0.0 | 0.0 | 3.0 | 1.0 | -2 | 1 | -2.0 | -6.6 | 33.3 | 50.0 | 0 | -1.47 | 50.0 | 50.0 |
Numbers/Game vs RAPM
X-axis = Numbers/Game (PTS+REB+AST+STL+BLK-TO-FGA), Y-axis = RAPM.
Advanced: Numbers = PTS+REB+AST+STL+BLK-TO-FGA, PM = total +/-, PM/G = per game, PM/40 = per 40 minutes, RAPM = Regularized Adj Plus-Minus, TS% = True Shooting, eFG% = Effective FG
2026-2027 Shot Zones
946 located field-goal attempts in 11 games (NBA Stats). Each zone is coloured by the player with the largest share of the team's made-shot points there (left) and of its misses there (right).
Pascal SiakamAndrew NembhardObi ToppinAaron NesmithJarace Walker
| Zone | FGM-FGA | FG% | Pts | Top scorer | Runner-up | Most misses | Runner-up |
|---|---|---|---|---|---|---|---|
| Restricted area | 182-266 | 68.4 | 364 | Pascal Siakam 16% (60 pts) | Obi Toppin 13% (46 pts) | Jarace Walker 13% (11 misses) | Pascal Siakam 13% (11 misses) |
| Paint (non-RA) | 97-196 | 49.5 | 194 | Pascal Siakam 25% (48 pts) | Andrew Nembhard 14% (28 pts) | Pascal Siakam 21% (21 misses) | Ivica Zubac 11% (11 misses) |
| Mid-range left | 13-34 | 38.2 | 26 | Andrew Nembhard 31% (8 pts) | Pascal Siakam 31% (8 pts) | Pascal Siakam 38% (8 misses) | Andrew Nembhard 29% (6 misses) |
| Mid-range center | 8-20 | 40.0 | 16 | Pascal Siakam 62% (10 pts) | Andrew Nembhard 12% (2 pts) | Pascal Siakam 42% (5 misses) | Aaron Nesmith 17% (2 misses) |
| Mid-range right | 12-33 | 36.4 | 24 | Andrew Nembhard 25% (6 pts) | Aaron Nesmith 17% (4 pts) | Andrew Nembhard 29% (6 misses) | Pascal Siakam 19% (4 misses) |
| Left corner 3 | 19-54 | 35.2 | 57 | Obi Toppin 21% (12 pts) | Quenton Jackson 21% (12 pts) | Obi Toppin 17% (6 misses) | Jarace Walker 14% (5 misses) |
| Right corner 3 | 25-69 | 36.2 | 75 | Aaron Nesmith 28% (21 pts) | Jay Huff 20% (15 pts) | Aaron Nesmith 25% (11 misses) | Kelly Oubre Jr. 23% (10 misses) |
| Above-break 3 left | 31-97 | 32.0 | 93 | Andrew Nembhard 19% (18 pts) | Pascal Siakam 19% (18 pts) | Andrew Nembhard 21% (14 misses) | Quenton Jackson 14% (9 misses) |
| Above-break 3 center | 26-78 | 33.3 | 78 | Andrew Nembhard 35% (27 pts) | Aaron Nesmith 15% (12 pts) | Aaron Nesmith 15% (8 misses) | Andrew Nembhard 15% (8 misses) |
| Above-break 3 right | 32-99 | 32.3 | 96 | Jarace Walker 19% (18 pts) | Andrew Nembhard 12% (12 pts) | Pascal Siakam 18% (12 misses) | Aaron Nesmith 15% (10 misses) |