 Golden State
2026-2027 Team Stats (13 games)
Model Outputs
Output is shown as model rating with league rank in parentheses when available.
| Model | Output | Notes |
|---|---|---|
| Elo Elo Streaming paired-comparison rating with recency baked into sequential updates. More → | 985 (#18) | - |
| Bradley-Terry Bradley-Terry Static logistic paired-comparison model with one team strength parameter. More → | 1074 (#10) | HCA +23 elo |
| Bradley-Terry Recency Bradley-Terry Recency Static Bradley-Terry with exponential recency weights on newer games. More → | 1066 (#11) | HCA +27 elo |
| Margin Margin Linear team-strength model fit on point differential instead of binary wins. More → | +3.7 (#10) | HCA +1.9 |
| Margin Recency Margin Recency Margin regression with exponential recency weights on newer games. More → | +3.1 (#11) | HCA +2.1 |
| Pythagorean Pythagorean Pythagorean win expectation from raw points scored and allowed. More → | 0.562 (#11) | - |
| Points Off/Def Points Off/Def Raw points regression with separate offensive and defensive team parameters. More → | 0.568 (#11) | AdjO 115.2 | AdjD 108.9 |
| Points Off/Def Recency Points Off/Def Recency Off/def points regression with exponential recency weights. More → | 0.559 (#11) | AdjO 114.6 | AdjD 108.6 |
| Dynamic Bradley-Terry Dynamic Bradley-Terry Time-evolving paired-comparison model with latent team strength drift. More → | 1063 (#11) | RD 113 | GP 13 |
Rank through the season
League rank each week from the model's fit of the games played by then, published the same way as the table above, so each line ends at the rank shown there. Select a point for its rating.
2026-2027 Schedule & Results
| Date | Vs/At | Opponent | Result | Score |
|---|---|---|---|---|
| 2026-10-21 | @ | Los Angeles Lakers | L | 105 - 127 |
| 2026-10-23 | vs | Memphis Grizzlies | L | 108 - 111 |
| 2026-10-24 | @ | Phoenix Suns | L | 122 - 131 |
| 2026-10-26 | @ | Denver Nuggets | W | 134 - 114 |
| 2026-10-28 | @ | Minnesota Timberwolves | W | 119 - 114 |
| 2026-10-30 | vs | Los Angeles Lakers | W | 112 - 95 |
| 2026-11-01 | vs | LA Clippers | W | 124 - 112 |
| 2026-11-02 | vs | Phoenix Suns | W | 116 - 113 |
| 2026-11-05 | vs | Miami Heat | W | 120 - 100 |
| 2026-11-07 | vs | Orlando Magic | W | 126 - 119 |
| 2026-11-09 | vs | New Orleans Pelicans | W | 138 - 87 |
| 2026-11-11 | @ | Houston Rockets | L | 108 - 115 |
| 2026-11-13 | @ | San Antonio Spurs | L | 85 - 123 |
| 2026-11-16 | @ | New Orleans Pelicans | - | Preview |
| 2026-11-18 | @ | Dallas Mavericks | - | Preview |
| 2026-11-19 | @ | Memphis Grizzlies | - | Preview |
2026-2027 Roster
Estimated Minutes by Position
Estimated from roster positions, box scores and minutes played. Each column totals one game's minutes, divided among the players. Use the labels or legend to highlight a player's estimated role.
| Player | Pos | GP | MIN | PTS | REB | AST | STL | BLK | TO | FGA | Numbers | PM | PM GP | PM/G | PM/40 | FG% | 3P% | FT% | RAPM | TS% | eFG% |
|---|---|---|---|---|---|---|---|---|---|---|---|---|---|---|---|---|---|---|---|---|---|
 Stephen Curry |
G | 10 | 26.5 | 27.8 | 3.7 | 3.9 | 0.9 | 0.1 | 1.7 | 16.0 | 18.7 | 82 | 10 | 8.2 | 12.5 | 50.0 | 45.7 | 98.7 | 2.24 | 71.9 | 63.4 |
 Yaxel Lendeborg |
- | 13 | 31.5 | 20.2 | 7.4 | 3.5 | 1.0 | 0.7 | 3.2 | 14.1 | 15.5 | - | - | - | - | 48.6 | 41.4 | 73.7 | - | 60.8 | 56.6 |
 Brandin Podziemski |
G | 11 | 32.5 | 16.5 | 4.9 | 3.8 | 1.2 | 0.5 | 1.2 | 12.6 | 13.1 | 52 | 11 | 4.7 | 5.8 | 46.0 | 39.7 | 71.0 | 1.39 | 59.3 | 57.2 |
 Brandon Williams |
G | 10 | 16.2 | 10.4 | 2.1 | 2.3 | 0.9 | 0.4 | 1.5 | 8.0 | 6.6 | 41 | 10 | 4.1 | 10.2 | 41.2 | 30.4 | 86.1 | 0.87 | 54.3 | 45.6 |
 De'Anthony Melton |
G | 13 | 22.1 | 9.9 | 4.2 | 2.4 | 1.3 | 0.5 | 1.3 | 7.8 | 9.2 | -16 | 13 | -1.2 | -2.2 | 39.6 | 42.0 | 83.3 | 0.42 | 57.8 | 54.0 |
 Charles Bassey |
C | 11 | 13.2 | 7.9 | 5.6 | 0.6 | 0.1 | 0.9 | 0.9 | 4.7 | 9.5 | 47 | 11 | 4.3 | 12.9 | 67.3 | 0.0 | 81.0 | -0.36 | 71.0 | 67.3 |
 Georges Niang |
F | 13 | 19.9 | 7.8 | 3.1 | 1.5 | 0.5 | 0.2 | 1.1 | 6.5 | 5.5 | 50 | 13 | 3.8 | 7.7 | 45.9 | 36.2 | 66.7 | 0.8 | 56.8 | 55.9 |
 Lj Cryer |
G | 10 | 9.2 | 6.1 | 0.5 | 1.7 | 0.1 | 0.0 | 0.2 | 5.1 | 3.1 | 6 | 10 | 0.6 | 2.6 | 41.2 | 45.7 | 75.0 | -0.06 | 57.8 | 56.9 |
 Will Richard |
G | 12 | 18.3 | 5.6 | 2.2 | 0.9 | 0.4 | 0.2 | 0.7 | 4.2 | 4.5 | -34 | 12 | -2.8 | -6.2 | 48.0 | 46.2 | 77.8 | -1.27 | 62.1 | 60.0 |
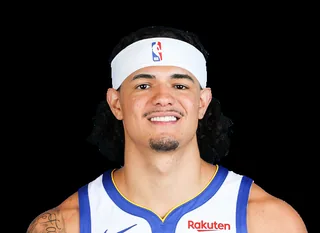 Gui Santos |
F | 10 | 18.7 | 5.6 | 3.9 | 1.4 | 0.4 | 0.5 | 1.1 | 4.7 | 6.0 | 40 | 10 | 4.0 | 8.6 | 40.4 | 27.8 | 61.9 | 0.74 | 49.8 | 45.7 |
 Graham Ike |
- | 10 | 9.6 | 4.8 | 2.4 | 1.1 | 0.4 | 0.3 | 0.4 | 3.8 | 4.8 | - | - | - | - | 47.4 | 55.6 | 87.5 | - | 57.8 | 53.9 |
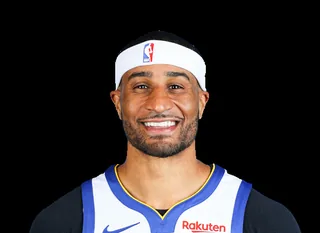 Gary Payton II |
G | 11 | 13.4 | 4.7 | 1.6 | 0.4 | 0.7 | 0.0 | 0.8 | 4.5 | 2.1 | -14 | 11 | -1.3 | -3.8 | 46.0 | 20.0 | 100.0 | -0.48 | 51.1 | 50.0 |
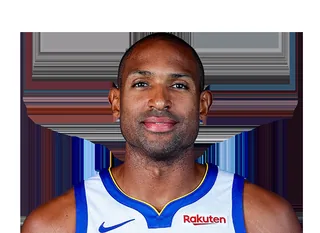 Al Horford |
Center | 11 | 17.2 | 4.3 | 3.6 | 2.0 | 0.4 | 0.8 | 0.5 | 4.4 | 6.2 | 19 | 11 | 1.7 | 4.0 | 37.5 | 33.3 | 0.0 | 0.09 | 48.5 | 49.0 |
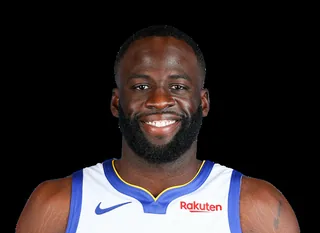 Draymond Green |
F | 11 | 25.9 | 3.3 | 4.7 | 7.1 | 0.9 | 0.8 | 2.8 | 3.4 | 10.6 | 6 | 11 | 0.5 | 0.8 | 40.5 | 23.1 | 50.0 | -0.05 | 45.4 | 44.6 |
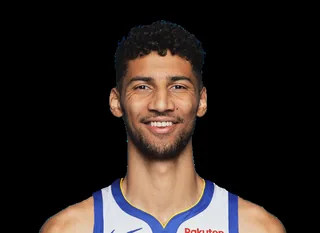 Malevy Leons |
- | 8 | 5.9 | 0.9 | 1.1 | 0.0 | 0.2 | 0.4 | 0.1 | 1.2 | 1.2 | 18 | 8 | 2.2 | 15.3 | 20.0 | 25.0 | 100.0 | -0.79 | 32.2 | 25.0 |
Numbers/Game vs RAPM
X-axis = Numbers/Game (PTS+REB+AST+STL+BLK-TO-FGA), Y-axis = RAPM.
Advanced: Numbers = PTS+REB+AST+STL+BLK-TO-FGA, PM = total +/-, PM/G = per game, PM/40 = per 40 minutes, RAPM = Regularized Adj Plus-Minus, TS% = True Shooting, eFG% = Effective FG
2026-2027 Shot Zones
692 located field-goal attempts in 8 games (NBA Stats). Each zone is coloured by the player with the largest share of the team's made-shot points there (left) and of its misses there (right).
Stephen CurryYaxel LendeborgBrandin PodziemskiDe'Anthony MeltonBrandon WilliamsWill Richard
| Zone | FGM-FGA | FG% | Pts | Top scorer | Runner-up | Most misses | Runner-up |
|---|---|---|---|---|---|---|---|
| Restricted area | 117-167 | 70.1 | 234 | Yaxel Lendeborg 21% (50 pts) | Charles Bassey 11% (26 pts) | Brandon Williams 14% (7 misses) | Yaxel Lendeborg 14% (7 misses) |
| Paint (non-RA) | 58-130 | 44.6 | 116 | Yaxel Lendeborg 22% (26 pts) | Brandon Williams 17% (20 pts) | Brandon Williams 17% (12 misses) | Yaxel Lendeborg 17% (12 misses) |
| Mid-range left | 6-23 | 26.1 | 12 | Brandin Podziemski 33% (4 pts) | Stephen Curry 33% (4 pts) | Brandin Podziemski 29% (5 misses) | Yaxel Lendeborg 29% (5 misses) |
| Mid-range center | 1-5 | 20.0 | 2 | Yaxel Lendeborg 100% (2 pts) | - | Stephen Curry 75% (3 misses) | Brandin Podziemski 25% (1 misses) |
| Mid-range right | 8-24 | 33.3 | 16 | Stephen Curry 38% (6 pts) | Brandin Podziemski 25% (4 pts) | Stephen Curry 25% (4 misses) | Will Richard 19% (3 misses) |
| Left corner 3 | 24-54 | 44.4 | 72 | Brandin Podziemski 25% (18 pts) | Georges Niang 17% (12 pts) | Brandin Podziemski 17% (5 misses) | Gary Payton II 17% (5 misses) |
| Right corner 3 | 16-46 | 34.8 | 48 | Will Richard 25% (12 pts) | Brandin Podziemski 19% (9 pts) | De'Anthony Melton 20% (6 misses) | Georges Niang 17% (5 misses) |
| Above-break 3 left | 32-89 | 36.0 | 96 | Stephen Curry 22% (21 pts) | De'Anthony Melton 19% (18 pts) | Brandin Podziemski 19% (11 misses) | Stephen Curry 16% (9 misses) |
| Above-break 3 center | 22-66 | 33.3 | 66 | Stephen Curry 32% (21 pts) | Yaxel Lendeborg 18% (12 pts) | Stephen Curry 25% (11 misses) | Brandin Podziemski 18% (8 misses) |
| Above-break 3 right | 36-88 | 40.9 | 108 | Stephen Curry 39% (42 pts) | Yaxel Lendeborg 19% (21 pts) | Stephen Curry 27% (14 misses) | Yaxel Lendeborg 19% (10 misses) |