 Detroit Pistons
2026-2027 Team Stats (11 games)
Model Outputs
Output is shown as model rating with league rank in parentheses when available.
| Model | Output | Notes |
|---|---|---|
| Elo Elo Streaming paired-comparison rating with recency baked into sequential updates. More → | 1137 (#3) | - |
| Bradley-Terry Bradley-Terry Static logistic paired-comparison model with one team strength parameter. More → | 1135 (#7) | HCA +9 elo |
| Bradley-Terry Recency Bradley-Terry Recency Static Bradley-Terry with exponential recency weights on newer games. More → | 1106 (#8) | HCA +10 elo |
| Margin Margin Linear team-strength model fit on point differential instead of binary wins. More → | +5.2 (#10) | HCA +1.6 |
| Margin Recency Margin Recency Margin regression with exponential recency weights on newer games. More → | +5.7 (#9) | HCA +1.7 |
| Pythagorean Pythagorean Pythagorean win expectation from raw points scored and allowed. More → | 0.683 (#6) | - |
| Points Off/Def Points Off/Def Raw points regression with separate offensive and defensive team parameters. More → | 0.620 (#9) | AdjO 115.7 | AdjD 111.1 |
| Points Off/Def Recency Points Off/Def Recency Off/def points regression with exponential recency weights. More → | 0.622 (#9) | AdjO 116.2 | AdjD 112.0 |
| Dynamic Bradley-Terry Dynamic Bradley-Terry Time-evolving paired-comparison model with latent team strength drift. More → | 1154 (#8) | RD 118 | GP 11 |
2026-2027 Schedule & Results
| Date | Vs/At | Opponent | Result | Score |
|---|---|---|---|---|
| 2026-10-20 | vs | Boston Celtics | W | 121 - 113 |
| 2026-10-23 | @ | Miami Heat | W | 128 - 111 |
| 2026-10-25 | @ | Philadelphia 76ers | W | 106 - 93 |
| 2026-10-27 | @ | New York Knicks | L | 97 - 111 |
| 2026-10-28 | vs | Charlotte Hornets | W | 97 - 89 |
| 2026-10-30 | @ | Brooklyn Nets | W | 110 - 94 |
| 2026-11-02 | @ | Charlotte Hornets | W | 124 - 91 |
| 2026-11-04 | vs | Philadelphia 76ers | L | 106 - 112 |
| 2026-11-08 | vs | Los Angeles Lakers | L | 116 - 121 |
| 2026-11-09 | vs | Washington Wizards | W | 122 - 111 |
| 2026-11-12 | @ | Washington Wizards | W | 144 - 140 |
| 2026-11-14 | @ | Miami Heat | - | Preview |
| 2026-11-17 | @ | San Antonio Spurs | - | Preview |
| 2026-11-18 | @ | New Orleans Pelicans | - | Preview |
| 2026-11-20 | vs | Toronto Raptors | - | Preview |
2026-2027 Roster
Estimated Minutes by Position
Estimated from roster positions, box scores and minutes played. Each column totals one game's minutes, divided among the players. Use the labels or legend to highlight a player's estimated role.
| Player | Pos | GP | MIN | PTS | REB | AST | STL | BLK | TO | FGA | Numbers | PM | PM GP | PM/G | PM/40 | FG% | 3P% | FT% | RAPM | TS% | eFG% |
|---|---|---|---|---|---|---|---|---|---|---|---|---|---|---|---|---|---|---|---|---|---|
 Cade Cunningham |
G | 11 | 34.6 | 25.0 | 5.2 | 7.9 | 1.5 | 0.9 | 3.2 | 18.0 | 19.4 | 40 | 10 | 4.0 | 4.8 | 48.5 | 31.4 | 83.6 | 1.66 | 59.8 | 54.0 |
 Duncan Robinson |
F | 11 | 31.8 | 18.1 | 1.9 | 2.2 | 1.5 | 0.2 | 1.0 | 12.0 | 10.8 | 102 | 10 | 10.2 | 13.2 | 45.5 | 43.7 | 82.9 | 1.79 | 66.3 | 62.5 |
 Daniss Jenkins |
G | 11 | 27.4 | 13.5 | 3.8 | 4.3 | 0.9 | 0.1 | 1.5 | 9.5 | 11.6 | 74 | 10 | 7.4 | 11.4 | 46.2 | 44.4 | 93.3 | 0.77 | 63.1 | 57.7 |
 Jalen Duren |
C | 2 | 19.0 | 13.0 | 7.5 | 2.0 | 1.0 | 1.0 | 1.0 | 8.5 | 15.0 | 11 | 2 | 5.5 | 11.5 | 58.8 | 0 | 85.7 | 0.8 | 64.7 | 58.8 |
 Paul Reed |
F | 11 | 27.1 | 11.5 | 7.7 | 2.3 | 1.0 | 0.9 | 1.9 | 8.5 | 13.0 | 58 | 10 | 5.8 | 9.0 | 56.4 | 55.6 | 64.0 | 1.49 | 60.5 | 59.0 |
 John Collins |
F | 11 | 26.3 | 10.6 | 5.9 | 0.7 | 0.5 | 1.0 | 1.0 | 8.7 | 9.1 | 13 | 10 | 1.3 | 2.0 | 49.0 | 41.4 | 73.3 | -0.44 | 57.0 | 55.2 |
 Ausar Thompson |
G | 10 | 28.7 | 10.1 | 8.7 | 5.0 | 1.3 | 0.8 | 2.6 | 8.5 | 14.8 | 38 | 9 | 4.2 | 6.2 | 49.4 | 0.0 | 68.0 | 1.53 | 52.6 | 49.4 |
 Kevin Huerter |
G | 11 | 23.2 | 9.0 | 2.5 | 2.1 | 0.9 | 0.9 | 0.8 | 7.5 | 7.1 | 35 | 10 | 3.5 | 6.1 | 43.9 | 34.7 | 66.7 | 0.87 | 55.9 | 54.3 |
 Isaiah Joe |
G | 3 | 13.7 | 7.3 | 1.7 | 1.0 | 0.3 | 0.3 | 0.7 | 6.3 | 3.7 | -14 | 3 | -4.7 | -13.4 | 36.8 | 23.1 | 62.5 | 0.19 | 48.8 | 44.7 |
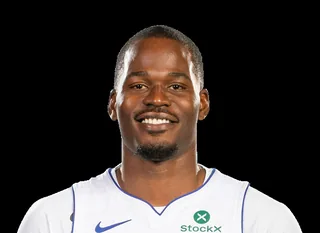 Javonte Green |
G | 11 | 17.4 | 6.1 | 2.3 | 0.5 | 0.8 | 0.4 | 0.0 | 4.8 | 5.3 | 67 | 10 | 6.7 | 15.3 | 39.6 | 30.0 | 92.9 | 1.63 | 56.6 | 50.9 |
 Ronald Holland II |
F | 11 | 15.4 | 4.9 | 3.5 | 1.7 | 0.5 | 0.8 | 1.0 | 5.0 | 5.5 | 5 | 10 | 0.5 | 1.3 | 34.5 | 28.0 | 69.2 | -0.11 | 44.5 | 40.9 |
 Chaz Lanier |
G | 4 | 3.5 | 3.2 | 0.0 | 0.0 | 0.0 | 0.0 | 0.0 | 1.8 | 1.5 | -7 | 4 | -1.8 | -21.5 | 71.4 | 60.0 | 0 | -0.54 | 92.9 | 92.9 |
 Ebuka Okorie |
- | 5 | 4.2 | 2.2 | 0.4 | 0.6 | 0.2 | 0.0 | 0.4 | 2.4 | 0.6 | 5 | 5 | 1.0 | 10.1 | 33.3 | 0.0 | 100.0 | 0.02 | 41.3 | 33.3 |
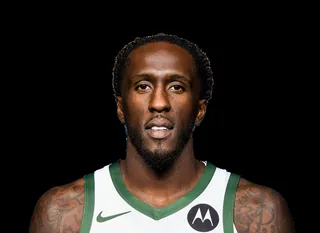 Taurean Prince |
F | 2 | 6.5 | 2.0 | 1.0 | 0.0 | 1.0 | 0.0 | 0.0 | 1.5 | 2.5 | 5 | 2 | 2.5 | 14.4 | 33.3 | 33.3 | 50.0 | -0.34 | 51.5 | 50.0 |
 Tolu Smith |
- | 7 | 4.0 | 0.9 | 1.6 | 0.1 | 0.1 | 0.3 | 0.3 | 0.7 | 2.0 | -27 | 7 | -3.9 | -39.4 | 40.0 | 0 | 33.3 | -1.19 | 39.3 | 40.0 |
 Isaac Jones |
C | 4 | 3.5 | 0.5 | 1.2 | 0.2 | 0.0 | 0.5 | 0.2 | 0.5 | 1.8 | -2 | 4 | -0.5 | -6.1 | 50.0 | 0.0 | 0 | -0.91 | 50.0 | 50.0 |
 Elijah Harkless |
- | 1 | 3.0 | 0.0 | 0.0 | 0.0 | 0.0 | 0.0 | 0.0 | 0.0 | 0.0 | - | - | - | - | 0 | 0 | 0 | - | 0 | 0 |
Numbers/Game vs RAPM
X-axis = Numbers/Game (PTS+REB+AST+STL+BLK-TO-FGA), Y-axis = RAPM.
Advanced: Numbers = PTS+REB+AST+STL+BLK-TO-FGA, PM = total +/-, PM/G = per game, PM/40 = per 40 minutes, RAPM = Regularized Adj Plus-Minus, TS% = True Shooting, eFG% = Effective FG
2026-2027 Shot Zones
964 located field-goal attempts in 11 games (NBA Stats). Each zone is coloured by the player with the largest share of the team's made-shot points there (left) and of its misses there (right).
Cade CunninghamDuncan RobinsonDaniss Jenkins
| Zone | FGM-FGA | FG% | Pts | Top scorer | Runner-up | Most misses | Runner-up |
|---|---|---|---|---|---|---|---|
| Restricted area | 174-256 | 68.0 | 348 | Cade Cunningham 18% (64 pts) | Paul Reed 18% (62 pts) | Cade Cunningham 20% (16 misses) | Ausar Thompson 16% (13 misses) |
| Paint (non-RA) | 83-198 | 41.9 | 166 | Cade Cunningham 24% (40 pts) | Paul Reed 17% (28 pts) | Cade Cunningham 16% (18 misses) | Paul Reed 16% (18 misses) |
| Mid-range left | 23-44 | 52.3 | 46 | Cade Cunningham 61% (28 pts) | Daniss Jenkins 22% (10 pts) | Cade Cunningham 33% (7 misses) | Daniss Jenkins 19% (4 misses) |
| Mid-range center | 5-16 | 31.2 | 10 | Cade Cunningham 40% (4 pts) | Ausar Thompson 20% (2 pts) | Cade Cunningham 45% (5 misses) | Ausar Thompson 18% (2 misses) |
| Mid-range right | 16-42 | 38.1 | 32 | Cade Cunningham 38% (12 pts) | Paul Reed 19% (6 pts) | Cade Cunningham 31% (8 misses) | Ausar Thompson 23% (6 misses) |
| Left corner 3 | 20-66 | 30.3 | 60 | Daniss Jenkins 30% (18 pts) | Javonte Green 20% (12 pts) | Duncan Robinson 22% (10 misses) | Cade Cunningham 15% (7 misses) |
| Right corner 3 | 20-64 | 31.2 | 60 | Duncan Robinson 35% (21 pts) | Daniss Jenkins 20% (12 pts) | Daniss Jenkins 16% (7 misses) | Duncan Robinson 16% (7 misses) |
| Above-break 3 left | 38-79 | 48.1 | 114 | Duncan Robinson 34% (39 pts) | Cade Cunningham 18% (21 pts) | Duncan Robinson 24% (10 misses) | Cade Cunningham 22% (9 misses) |
| Above-break 3 center | 33-80 | 41.2 | 99 | Duncan Robinson 39% (39 pts) | Cade Cunningham 18% (18 pts) | Cade Cunningham 30% (14 misses) | Duncan Robinson 17% (8 misses) |
| Above-break 3 right | 40-119 | 33.6 | 120 | Duncan Robinson 22% (27 pts) | Cade Cunningham 18% (21 pts) | Duncan Robinson 29% (23 misses) | Cade Cunningham 20% (16 misses) |