 Chattanooga
2026-2027 Team Stats (4 games)
Model Outputs
Output is shown as model rating with league rank in parentheses when available.
| Model | Output | Notes |
|---|---|---|
| Elo Elo Streaming paired-comparison rating with recency baked into sequential updates. More → | 821 (#263) | Preseason prior 797 (returning production + recruiting): last season 891, returning -22, transfers -32, freshmen -41 |
| Bradley-Terry Bradley-Terry Static logistic paired-comparison model with one team strength parameter. More → | 925 (#243) | HCA +206 elo |
| Bradley-Terry Recency Bradley-Terry Recency Static Bradley-Terry with exponential recency weights on newer games. More → | 928 (#240) | HCA +205 elo |
| Margin Margin Linear team-strength model fit on point differential instead of binary wins. More → | +4.0 (#117) | HCA +2.2 |
| Margin Recency Margin Recency Margin regression with exponential recency weights on newer games. More → | +4.1 (#117) | HCA +2.2 |
| Pythagorean Pythagorean Pythagorean win expectation from raw points scored and allowed. More → | 0.326 (#214) | - |
| Adjusted Efficiency Adjusted Efficiency Opponent-adjusted efficiency model with separate offensive and defensive components. More → | 0.494 (#151) | AdjNet +6.4 |
| Log Adjusted Log Adjusted Log-scale adjusted efficiency model that downweights blowout leverage. More → | 0.496 (#151) | AdjNet +6.6 |
| Points Off/Def Points Off/Def Raw points regression with separate offensive and defensive team parameters. More → | 0.547 (#124) | AdjO 80.5 | AdjD 71.7 |
| Points Off/Def Recency Points Off/Def Recency Off/def points regression with exponential recency weights. More → | 0.549 (#122) | AdjO 80.5 | AdjD 71.7 |
| Core Ensemble Core Ensemble Equal-logit blend of Elo, recency BT, recency margin, log-adjusted pyth, and points off/def. More → | 0.500 (#150) | Blend of Elo, BT, Margin, PythLog, PtsOD |
| Recency Ensemble Recency Ensemble Equal-logit blend of Elo, recency BT, recency margin, log-adjusted pyth, and recency points off/def. More → | 0.501 (#150) | Blend of Elo, BT, Margin, PythLog, PtsOD |
| Dynamic Bradley-Terry Dynamic Bradley-Terry Time-evolving paired-comparison model with latent team strength drift. More → | 908 (#243) | RD 188 | GP 3 |
| Adjusted Context Blend Adjusted Context Blend Chronologically trained component blend with rest and signed venue context. More → | 0.377 (#229) | Chronological component blend with rest and venue. |
Rank through the season
League rank each week from the model's fit of the games played by then, published the same way as the table above, so each line ends at the rank shown there. Select a point for its rating.
2026-2027 Schedule & Results
| Date | Vs/At | Opponent | Result | Score |
|---|---|---|---|---|
| 2026-11-02 | @ | Louisville Cardinals | L | 70 - 84 |
| 2026-11-05 | @ | Penn State Nittany Lions | L | 93 - 97 |
| 2026-11-09 | vs | Covenant Fighting Scots | W | 97 - 67 |
| 2026-11-13 | @ | Elon Phoenix | W | 77 - 70 |
| 2026-11-18 | @ | Winthrop Eagles | - | Preview |
| 2026-11-21 | vs | Radford Highlanders | - | Preview |
2026-2027 Roster
Estimated Minutes by Position
Estimated from roster positions, box scores and minutes played. Each column totals one game's minutes, divided among the players. Use the labels or legend to highlight a player's estimated role.
| Player | Pos | GP | MIN | PTS | REB | AST | STL | BLK | TO | FGA | Numbers | PM | PM GP | PM/G | PM/40 | FG% | 3P% | FT% | RAPM | TS% | eFG% |
|---|---|---|---|---|---|---|---|---|---|---|---|---|---|---|---|---|---|---|---|---|---|
 Kobe McDowell-White |
G | 4 | 32.2 | 13.8 | 4.0 | 5.5 | 1.5 | 0.0 | 3.2 | 7.0 | 14.5 | 28 | 4 | 7.0 | 8.7 | 64.3 | 65.0 | 75.0 | 1.24 | 87.2 | 87.5 |
 Matt Hampton |
G | 4 | 27.8 | 13.2 | 3.2 | 1.8 | 0.8 | 0.0 | 1.2 | 10.5 | 7.2 | 24 | 4 | 6.0 | 8.7 | 40.5 | 10.0 | 72.0 | 0.58 | 50.0 | 41.7 |
 Lenny Anigbata |
G | 4 | 27.8 | 12.0 | 6.0 | 1.8 | 1.2 | 0.2 | 1.5 | 8.8 | 11.0 | 16 | 4 | 4.0 | 5.7 | 51.4 | 36.4 | 66.7 | 0.35 | 63.8 | 62.9 |
 Yonatan Levy |
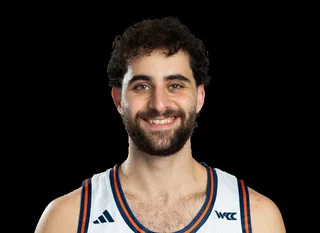
F | 4 | 22.2 | 10.2 | 4.8 | 3.0 | 0.8 | 0.2 | 1.8 | 9.2 | 8.0 | 43 | 4 | 10.8 | 19.3 | 37.8 | 26.3 | 72.7 | 0.86 | 49.0 | 44.6 |
 Christian Matos |
G | 4 | 20.8 | 8.8 | 2.8 | 1.5 | 0.0 | 0.0 | 1.2 | 7.0 | 4.8 | -3 | 4 | -0.8 | -1.5 | 46.4 | 31.2 | 80.0 | 0.08 | 57.9 | 55.4 |
 Zach Bleshoy |
G | 4 | 25.8 | 8.5 | 6.0 | 3.0 | 3.2 | 0.2 | 2.2 | 6.8 | 12.0 | 14 | 4 | 3.5 | 5.4 | 37.0 | 20.0 | 73.3 | 0.19 | 50.6 | 42.6 |
 Josh Bowman |
F | 4 | 11.2 | 7.0 | 2.0 | 0.8 | 0.0 | 0.0 | 1.0 | 6.0 | 2.8 | -5 | 4 | -1.2 | -4.6 | 50.0 | 14.3 | 42.9 | -1.04 | 51.7 | 52.1 |
 Sean Cusano |
G | 4 | 12.8 | 4.2 | 4.5 | 0.2 | 0.5 | 0.5 | 0.8 | 2.0 | 7.2 | 10 | 4 | 2.5 | 7.9 | 75.0 | 0.0 | 83.3 | -0.14 | 79.9 | 75.0 |
 Anthony Swift |
F | 2 | 5.0 | 4.0 | 2.0 | 0.0 | 0.0 | 0.0 | 0.5 | 2.0 | 3.5 | -2 | 2 | -1.0 | -8.8 | 50.0 | 50.0 | 100.0 | -0.22 | 82.0 | 75.0 |
 Liam Vitters |
G | 2 | 1.5 | 2.0 | 0.0 | 0.0 | 0.0 | 0.0 | 0.0 | 1.0 | 1.0 | 2 | 2 | 1.0 | 22.0 | 100.0 | 0 | 0 | -0.12 | 100.0 | 100.0 |
 Houston Holland |
G | 3 | 7.3 | 1.7 | 2.7 | 0.7 | 0.0 | 0.0 | 0.3 | 1.7 | 3.0 | -5 | 3 | -1.7 | -8.9 | 20.0 | 0.0 | 75.0 | -0.07 | 37.0 | 20.0 |
 Yssam Moungalla |
G | 2 | 3.0 | 1.5 | 0.5 | 0.0 | 0.0 | 0.0 | 0.0 | 1.5 | 0.5 | -5 | 2 | -2.5 | -30.3 | 33.3 | 33.3 | 0 | -0.33 | 50.0 | 50.0 |
 John Fleeman |
C | 4 | 6.0 | 1.0 | 1.0 | 0.5 | 0.0 | 0.0 | 0.2 | 1.2 | 1.0 | -18 | 4 | -4.5 | -29.5 | 20.0 | 0 | 100.0 | -1.21 | 34.0 | 20.0 |
 Caleb Hardaway |
F | 2 | 1.0 | 1.0 | 0.5 | 0.0 | 0.0 | 0.0 | 0.0 | 0.5 | 1.0 | 3 | 2 | 1.5 | 47.7 | 100.0 | 0 | 0 | -0.09 | 100.0 | 100.0 |
 Tate Darner |
G | 0 | - | 0.0 | 0.0 | 0.0 | - | - | - | - | - | - | - | - | - | - | - | - | - | - | - |
 Tyler Houser |
F | 0 | - | 0.0 | 0.0 | 0.0 | - | - | - | - | - | - | - | - | - | - | - | - | - | - | - |
 Tre Powell |
G | 1 | 12.0 | 0.0 | 1.0 | 1.0 | 1.0 | 0.0 | 1.0 | 4.0 | -2.0 | -7 | 1 | -7.0 | -24.3 | 0.0 | 0.0 | 0 | -0.59 | 0.0 | 0.0 |
Numbers/Game vs RAPM
X-axis = Numbers/Game (PTS+REB+AST+STL+BLK-TO-FGA), Y-axis = RAPM.
Advanced: Numbers = PTS+REB+AST+STL+BLK-TO-FGA, PM = total +/-, PM/G = per game, PM/40 = per 40 minutes, RAPM = Regularized Adj Plus-Minus, TS% = True Shooting, eFG% = Effective FG
Alumni in the Pros
Former Chattanooga players in NBA 2026-2027, G League 2026-2027, EuroCup 2026-2027, matched by provider player ids (ESPN athlete ids, ESPN bios, linked StatsNBA/EuroLeague ids). Only games after their last Chattanooga game count. These are observed results, not certified complete seasons. League and team are where each player last played a regular-season or playoff game (NBA ahead of G League when he played in both); recent games include the preseason.
Active alumni
| Player | At School | League | Team | GP | MPG | PPG | RPG | APG | Last game | Last 30 days |
|---|---|---|---|---|---|---|---|---|---|---|
| Malachi Smith | 2020-22 | NBA | Toronto Raptors | 2 | 1.2 | 0.0 | 0.0 | 0.0 | 11-12 0 pts, 0 reb, 0 ast | 2 GP, 0.0 PPG, 0.0 RPG, 0.0 APG |
| Matt Ryan | 2019-20 | EuroCup | Maxima Roma | 1 | 25.9 | 16.0 | 4.0 | 3.0 | 09-30 16 pts, 4 reb, 3 ast | no games |
Alumni around the leagues: recent games
| Date | Player | League | Team | Opponent | MIN | PTS | REB | AST | Box |
|---|---|---|---|---|---|---|---|---|---|
| 2026-11-12 | Malachi Smith | NBA | Toronto Raptors | @ Philadelphia 76ers | 2 | 0 | 0 | 0 | Box |
| 2026-11-11 | Malachi Smith | G League Play-In | Raptors 905 | vs Greensboro Swarm | 35 | 31 | 10 | 4 | Box |
| 2026-11-09 | Malachi Smith | NBA | Toronto Raptors | vs Memphis Grizzlies | 1 | 0 | 0 | 0 | Box |
| 2026-09-30 | Matt Ryan | EuroCup | Maxima Roma | vs U-BT Cluj-Napoca | 26 | 16 | 4 | 3 | Box |
2026-2027 Shot Zones
253 located field-goal attempts in 4 games (ESPN). Each zone is coloured by the player with the largest share of the team's made-shot points there (left) and of its misses there (right).
Kobe McDowell-WhiteLenny AnigbataMatt HamptonYonatan LevyChristian MatosZach BleshoyJohn Fleeman
| Zone | FGM-FGA | FG% | Pts | Top scorer | Runner-up | Most misses | Runner-up |
|---|---|---|---|---|---|---|---|
| Restricted area | 68-108 | 63.0 | 136 | Matt Hampton 21% (28 pts) | Josh Bowman 15% (20 pts) | Matt Hampton 32% (13 misses) | Yonatan Levy 20% (8 misses) |
| Paint (non-RA) | 6-18 | 33.3 | 12 | Kobe McDowell-White 33% (4 pts) | John Fleeman 17% (2 pts) | John Fleeman 17% (2 misses) | Josh Bowman 17% (2 misses) |
| Mid-range left | 1-3 | 33.3 | 2 | Christian Matos 100% (2 pts) | - | Matt Hampton 100% (2 misses) | - |
| Mid-range center | 0-0 | - | 0 | - | - | - | - |
| Mid-range right | 2-3 | 66.7 | 4 | Matt Hampton 100% (4 pts) | - | Matt Hampton 100% (1 misses) | - |
| Left corner 3 | 4-11 | 36.4 | 12 | Lenny Anigbata 50% (6 pts) | Anthony Swift 25% (3 pts) | Christian Matos 29% (2 misses) | Lenny Anigbata 29% (2 misses) |
| Right corner 3 | 5-15 | 33.3 | 15 | Christian Matos 40% (6 pts) | Kobe McDowell-White 40% (6 pts) | Matt Hampton 30% (3 misses) | Yonatan Levy 20% (2 misses) |
| Above-break 3 left | 6-33 | 18.2 | 18 | Kobe McDowell-White 33% (6 pts) | Anthony Swift 17% (3 pts) | Kobe McDowell-White 19% (5 misses) | Lenny Anigbata 19% (5 misses) |
| Above-break 3 center | 5-16 | 31.2 | 15 | Lenny Anigbata 40% (6 pts) | Yonatan Levy 40% (6 pts) | Yonatan Levy 45% (5 misses) | Houston Holland 9% (1 misses) |
| Above-break 3 right | 19-46 | 41.3 | 57 | Kobe McDowell-White 42% (24 pts) | Lenny Anigbata 16% (9 pts) | Zach Bleshoy 26% (7 misses) | Lenny Anigbata 19% (5 misses) |