Recruiting Rankings, Freshmen, and Early-Season Elo
Every fall, the first few weeks of college basketball are the hardest to predict. Rosters turn over, transfers arrive, and a new freshman class shows up with nothing but recruiting rankings attached. We built a model that turns those rankings into a predicted freshman season, then used it to start each team's Elo rating from a roster- and recruiting-aware preseason estimate. Here is how well that works.
All numbers below were re-run on October 12, 2026 against current site data. Every test is out of sample: the model never saw the seasons it is scored on. This update adds what the recruiting data covers, what happens to freshmen it misses, and whether a model built only from what is available deeper in a class could rate many more recruits.
The short version
- Recruiting rankings do predict freshman production, but loosely. On 1,462 freshmen from the 2019-20 to 2024-25 seasons, the model explains about 21% of the variation in freshman Game Score per 40 minutes. Its rank correlation with the actual results is 0.31.
- On average it is well calibrated. The top 10% of predictions averaged 11.1, and those freshmen actually produced 11.1. Five-stars were predicted at 11.7 and produced 11.8.
- Freshman recruiting makes early-season Elo predictions better. Over six held-out seasons (2017-18 to 2022-23), adding recruiting rankings to an otherwise identical preseason estimate lowered log loss by 6.6 milli-nats per game in weeks 1-4 (95% CI 4.2 to 9.1). That is about a third of the total gain from a full preseason estimate (20.8 milli-nats). Early-season pick accuracy rises from 74.6% with plain carryover to 76.3% with the full estimate.
- 2025-26 shows the same result. This season was not used to fit anything. Recruiting added 10.0 milli-nats in weeks 1-4 (CI 3.6 to 16.2). The full preseason estimate beat plain carryover by 35.1.
- Most freshmen are not in the recruiting data, and that is mostly fine. About 81% of players making their Division I debut have no 247Sports profile in our database. They average 6.8 Game Score per 40 minutes, just above replacement level (6.4), and that barely changes with the strength of the program they join. Counting them at that measured value instead of as flat newcomers did not improve Elo.
- A deeper-class model would not add much. A model using only what 247 shows for every recruit (rating, offers, visits, college choice) explains 16.5% of freshman variation, below star tiers alone (18.4%). For recruits with no rating or ranking it does no better than their group average.
- Status: the site's Elo code already supports these preseason starts. The 2026-27 values will be written once enough 2026-27 rosters are published. As of today no preseason values are stored, so the site's Elo does not use them yet.
What the model predicts
Inputs come from 247Sports recruiting profiles:
- the 247 composite rating, filled in from national rank when it is missing
- national, position and state rank
- the number of scholarship offers and the strength of the programs that made them
- official and unofficial visits
- the strength of the program the player enrolls at
Output is the player's freshman-season Game Score per 40 minutes. Game Score is John Hollinger's one-number box-score summary: points plus a credit for rebounds, assists, steals and blocks, minus missed shots, turnovers and fouls. Low-minute seasons are pulled toward replacement level, so a freshman who played 30 minutes does not get an extreme number. For reference:
| Benchmark | Game Score per 40 |
|---|---|
| Replacement level (deep bench) | 6.4 |
| Typical 3-star freshman | 7.2 |
| Typical 5-star freshman | 11.8 |
| Cooper Flagg, Duke 2024-25 | 20.6 |
There is no recruit-to-player link in the data, so each recruit is matched to his first college box scores by name, school and year. That works for 86% of recruits. Most of the rest never played Division I minutes. The model is a gradient-boosted regression trained on 1,915 freshmen from 2010-11 to 2018-19. It is tested on the 1,462 who entered from 2019-20 to 2024-25 (2023-24 is missing from our historical box scores).
How accurate is it?
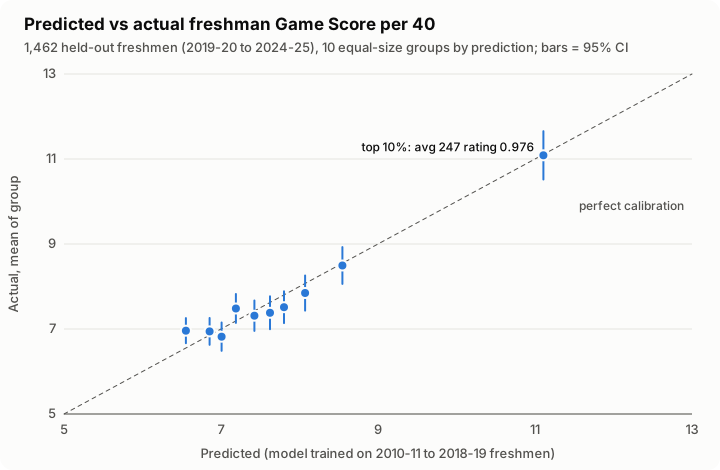
Each dot is about 146 held-out freshmen grouped by their prediction. The dots sit on the diagonal: when the model says a group should produce 8.5, it produces about 8.5. The model is right about groups but noisy about individuals. A typical miss is 2.4 points of Game Score per 40, about two-thirds of the gap between a typical 4-star (8.2) and a typical 5-star (11.8).
| Model (held-out 2019-20 to 2024-25) | Variance explained (R²) | Rank correlation | Typical miss |
|---|---|---|---|
| Star tier only (5/4/3-star averages) | 0.184 | 0.270 | 2.41 |
| 247 composite rating | 0.174 | 0.278 | 2.43 |
| Full model (ranks, offers, visits, program) | 0.209 | 0.309 | 2.38 |
| Without rankings (rating, offers, visits, program) | 0.165 | 0.271 | 2.44 |
| Tier (247 composite) | Freshmen | Predicted | Actual |
|---|---|---|---|
| 5-star (0.98+) | 98 | 11.69 | 11.79 |
| 4-star (0.90-0.98) | 425 | 8.16 | 8.19 |
| 3-star (0.80-0.90) | 405 | 7.57 | 7.22 |
| Unrated but in the 247 database | 532 | 7.03 | 7.15 |
Removing one input group at a time shows where the signal comes from.
- Rankings carry the most information beyond the rating itself.
- Offers and visits add a little, but not clearly more than zero. Offer data is sparse before the 2016 class.
- Where the player enrolls also adds a little, again not clearly more than zero.
The model is most useful for predicting playing time and impact together. On "contribution" (Game Score above replacement, weighted by share of team minutes), its R² is 0.27.
The last two freshman classes
Predictions for each class use only earlier classes. The 2025-26 actuals come from ESPN box scores because our other box-score source does not cover that season yet. On 2024-25, where both sources exist, the two agree closely: 235 freshmen, correlation 0.99. PPG and MPG count games against Division I opponents.
Class of 2025 (freshmen in 2025-26). 461 recruits; 337 played D1 minutes. The rank correlation between predicted and actual is 0.27, a little below the held-out test.
| 247 rank | Player | School | Predicted GmSc/40 | Actual GmSc/40 | MPG | PPG |
|---|---|---|---|---|---|---|
| 1 | Darryn Peterson | Kansas | 14.2 | 17.3 | 29.0 | 20.2 |
| 2 | AJ Dybantsa | BYU | 13.7 | 20.3 | 34.8 | 25.5 |
| 3 | Cameron Boozer | Duke | 13.3 | 23.3 | 33.5 | 22.5 |
| 4 | Nate Ament | Tennessee | 13.8 | 15.0 | 29.7 | 16.7 |
| 5 | Darius Acuff Jr. | Arkansas | 12.6 | 19.4 | 35.2 | 23.5 |
| 6 | Mikel Brown Jr. | Louisville | 11.6 | 15.3 | 29.2 | 18.2 |
| 7 | Chris Cenac Jr. | Houston | 14.2 | 12.4 | 24.9 | 9.5 |
| 8 | Caleb Wilson | North Carolina | 11.6 | 21.0 | 31.5 | 19.8 |
| 9 | Brayden Burries | Arizona | 12.8 | 16.1 | 29.7 | 16.1 |
| 10 | Alijah Arenas | USC | 11.3 | 9.3 | 27.6 | 14.1 |
| 11 | Koa Peat | Arizona | 11.1 | 14.9 | 27.9 | 14.1 |
| 12 | Braylon Mullins | UConn | 11.9 | 10.5 | 28.2 | 12.0 |
Class of 2024 (freshmen in 2024-25). 327 recruits; 246 played D1 minutes. Rank correlation 0.34.
| 247 rank | Player | School | Predicted GmSc/40 | Actual GmSc/40 | MPG | PPG |
|---|---|---|---|---|---|---|
| 1 | Cooper Flagg | Duke | 13.4 | 20.6 | 30.6 | 19.2 |
| 2 | Ace Bailey | Rutgers | 12.6 | 13.5 | 33.4 | 17.6 |
| 3 | Dylan Harper | Rutgers | 13.0 | 16.8 | 32.6 | 19.4 |
| 4 | Khaman Maluach | Duke | 12.0 | 15.8 | 21.3 | 8.6 |
| 5 | VJ Edgecombe | Baylor | 13.2 | 14.6 | 32.6 | 15.0 |
| 6 | Tre Johnson | Texas | 12.9 | 13.8 | 34.7 | 19.9 |
| 7 | Jalil Bethea | Miami | 9.3 | 7.7 | 18.9 | 7.1 |
| 8 | Ian Jackson | North Carolina | 9.7 | 11.4 | 23.8 | 11.9 |
| 9 | Jayden Quaintance | Arizona State | 9.6 | 12.1 | 29.6 | 9.4 |
| 10 | Liam McNeeley | UConn | 11.5 | 10.9 | 32.6 | 14.5 |
| 11 | Drake Powell | North Carolina | 10.6 | 9.2 | 25.6 | 7.4 |
| 12 | Derik Queen | Maryland | 11.9 | 17.0 | 30.4 | 16.5 |
Two things stand out:
- The model cannot pick out a generational player. It puts Flagg, Bailey and Harper within a point of each other (12.6 to 13.4), because their recruiting profiles are nearly identical. Flagg's 20.6 was far beyond anything a rating can tell you.
- These two classes beat their predictions at the top. The top 12 of the class of 2025 averaged 16.3 against a predicted 12.7. The class of 2024's top 12 averaged 13.6 against 11.7. Across all held-out freshmen, the national top 10 came in slightly below prediction (11.9 actual vs 12.9 predicted, 51 players). The last two classes were unusually productive at the top; the model is not biased low.
Who is in the recruiting data, and who is not
What we hold. The database has 7,149 men's 247Sports profiles. 6,238 of them can be placed in a class: 283 to 463 per class from 2016 on, while earlier classes are thinner or lack ratings. The class of 2025, for example, has 15 five-stars, 177 four-stars, 258 three-stars and 13 players with no rating. Most come from the top 300-500 of their class. In each class since 2016, the deepest national ranking we hold is usually between #320 and #490, but 117 to 326 of the rankings above it are missing.
Why the site showed no three-stars. The stored star count was a scraping bug, not a gap in the source. 247 draws five star icons for every player, filled or empty, and the scraper counted all of them, so every recruit was a "5-star". The tiers in this report have always come from the 247 composite rating. The recruit pages now use those tiers too. The rankings crawl had a second bug. It asked for "ranks 151-300" in a form 247 ignores, so every page it saved was the same top 50.
Can we collect more? Not for now. robots.txt allows these pages on every source we checked, but the terms of use do not:
- 247Sports' terms (CBS) prohibit scraping and other automated collection.
- Rivals now redirects to On3, and On3 answers automated requests with a bot challenge.
- ESPN's terms (Disney) prohibit automated extraction.
The scraper bugs are fixed in code, but no deeper crawl has been run.
Who is missing. About 1,700-1,800 players debut in Division I each season. That count includes junior-college and international newcomers as well as freshmen. From 2017-18 on, only about one in five (18-20%) is matched to a 247 recruit, and those matched players take 27-30% of all debutant minutes. Earlier seasons are thinner still: 5-16% matched from 2011-12 to 2016-17.
A model for deeper classes? Below the national rankings, 247 profiles still list a rating (sometimes), scholarship offers, visits and the eventual college. A model built only on those inputs scores 0.165 R² on held-out freshmen, short of star tiers alone (0.184). On the 532 held-out recruits with neither a rating nor a ranking, the inputs that would be available for every deeper recruit do no better than predicting that group's average (R² -0.03). Without a rating, the model is worse than the average. So for players outside the ranked list, a group average is as good as the data allows.
What an unlisted newcomer is worth. Every Division I debut from 2011-12 to 2022-23, grouped by 247 tier and by the strength of the program he joined (last season's rating, split into thirds):
| First D1 season, Game Score per 40 | Top-third program | Middle third | Bottom third | Players |
|---|---|---|---|---|
| 5-star | 11.4 | 10.9 | 11.2 | 211 |
| 4-star | 8.2 | 8.4 | 8.5 | 867 |
| 3-star | 7.4 | 7.2 | 7.2 | 1,006 |
| 2-star, or in 247 with no rating | 6.8 | 7.3 | 7.3 | 787 |
| No 247 profile | 6.9 | 6.9 | 6.8 | 17,928 |
Small cells (a 5-star at a bottom-third program) are pulled toward their tier's average. Players with no 247 profile average 6.8, about half a point above replacement level. They play 4-6% of their team's minutes at every program level. Conference was the intended grouping, but our conference records only cover the current season, so program strength stands in for it.
Does it make Elo better?
Elo rates every team and updates after each game. The question is where a team should start in November. Three options:
- Reset everyone to 1000. This is how the site's Elo originally worked: every team starts equal, so early-season predictions are close to coin flips with a home-court edge.
- Carry last season over, pulled 15% back toward average. This is the standard fix.
- Build a preseason estimate. Start from last season's rating, then adjust for production that returns or leaves, transfers in, and the incoming freshman class. An estimate without recruiting counts every freshman as a replacement-level player. One with recruiting counts 247-ranked freshmen by star tier.
We scored each option by log loss, which rewards confident correct picks and punishes confident wrong ones (lower is better; a coin flip scores 0.693). One milli-nat is 0.001 of log loss per game. The test covers 28,982 Division I games in six held-out seasons. The weights were tuned on 2011-12 to 2016-17.
| Preseason start | Log loss, weeks 1-4 | Accuracy, weeks 1-4 | Log loss, season | Accuracy, season |
|---|---|---|---|---|
| Reset everyone to 1000 | 0.5649 | 71.5% | 0.5891 | 68.9% |
| Carry last season over | 0.4948 | 74.6% | 0.5443 | 71.4% |
| + returning, departing and transfer production | 0.4806 | 76.0% | 0.5398 | 72.0% |
| + freshman recruiting rankings | 0.4740 | 76.3% | 0.5366 | 72.2% |
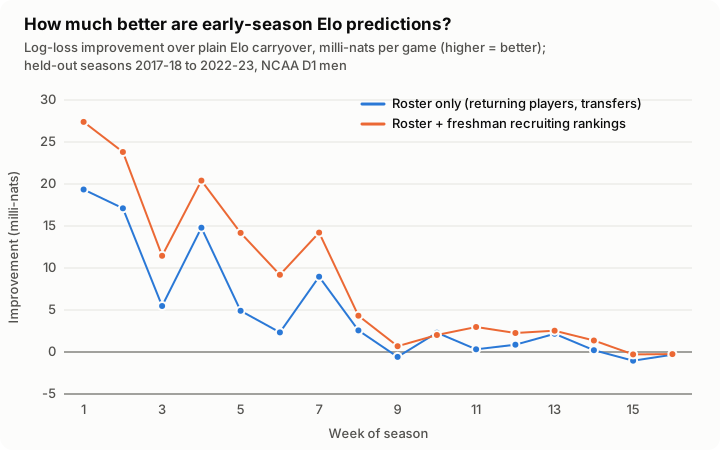
The gap between the two lines is what recruiting adds. It is largest in the first two weeks and fades by about week 8, once games have told Elo who is good.
| Recruiting's added value (with minus without) | Weeks 1-2 | Weeks 1-4 | Weeks 1-6 | Full season |
|---|---|---|---|---|
| Held-out 2017-18 to 2022-23 | -7.4 [-10.9, -3.8] | -6.6 [-9.1, -4.2] | -7.0 [-9.0, -5.0] | -3.1 [-3.9, -2.3] |
| 2025-26 (not used in fitting) | -19.8 [-28.6, -11.2] | -10.0 [-16.2, -3.6] | -9.7 [-14.9, -4.5] | -3.7 [-5.6, -1.8] |
Milli-nats per game; negative is better; brackets are 95% confidence intervals. In the held-out seasons, "without" is a separately fitted estimate that counts freshmen only as replacement-level newcomers. For 2025-26, "without" is the production estimate with every team's recruiting class set to the Division I average.
Some details matter:
- Tier counts are enough. Feeding Elo the full freshman model instead of a simple count of 5-, 4- and 3-stars per team made no difference (0.0 milli-nats, CI -0.8 to +0.7). The production version uses tier counts.
- Measured newcomer values do not beat the flat count. Replacing the tier counts with the expected value of every newcomer (the table above) made weeks 1-4 worse by 5.4 milli-nats (CI 3.4 to 7.5). Replacing only the flat count of unlisted newcomers was 0.3 worse (CI 0.1 to 0.5). Because unlisted newcomers average about the same everywhere, counting them flat already matches the data. The production estimate keeps the tier counts.
- It helped in five of six test seasons. The exception, 2021-22, was roughly neutral. That was the season of the COVID extra year and the one-time transfer waiver, when roster continuity broke down.
- 2025-26 in full. Weeks 1-4 log loss: reset 0.572, carryover 0.497, preseason estimate without recruiting 0.471, with recruiting 0.461 (1,246 games). For the full season (5,753 games): 0.592, 0.557, 0.549, 0.545. Pick accuracy in weeks 1-4 was 75.3% with carryover, 77.2% without recruiting and 76.2% with it. Over 1,246 games, accuracy moves about a point either way by chance. Log loss, which also scores confidence, improved clearly.
Caveats
- Coverage. The recruiting database holds roughly the top 300-450 players in each class from 2016 on, fewer before. About 81% of Division I debutants have no 247 profile. In the Elo estimate they count as flat newcomers, which matched the data as well as their measured value (see above).
- Tiers come from the 247 composite. The stored star count was a scraping bug (5 for everyone). Tiers are derived from the composite: 5-star is 0.98+, 4-star 0.90+, 3-star 0.80+.
- Game Score is not adjusted for opponents. That understates freshmen who play tougher schedules. The enrolled-program input partly corrects for it.
- Roster hindsight in the tests. In the historical test, who is on each roster comes from that season's box scores. The 2025-26 check used rosters scraped in January. Both know which players actually suited up, so the true preseason test is 2026-27.
- Uncertainty is understated. The confidence intervals resample games, not seasons, and there are only six test seasons. Read the per-season results as well.
- A missing season. 2023-24 is missing from our historical box scores. The class of 2023 is therefore absent from the freshman model, and the class of 2024's program-strength inputs rest on a thin 2023-24 schedule.
- Matching is by name. Recruits are linked to college box scores by name, school and year (86% matched). A player first seen two years after his class is counted as a redshirt freshman only when the year in between has box scores.
- Class year can be misread. It is inferred from commitment, signing and enrollment dates. A spring "Enrolled" date is read as a mid-year enrollee of the season then ending, which misplaces some early enrollees for the next season (about 2.5% of recruits). The example tables above leave out recruits whose decisions all came after their supposed freshman season began.
Reproduce
scripts/dev/ro_python.sh -m modeling.recruiting.extract --out ../recruiting-data/raw
PYTHONPATH=. python -m modeling.recruiting.run_experiment --data ../recruiting-data --export-prior config/freshman_prior.json
PYTHONPATH=. python -m modeling.backtest_elo_priors --data ../recruiting-data
scripts/dev/ro_python.sh -m modeling.backtest_elo_priors --production-season 2025-2026 --chain-from 2023-2024
PYTHONPATH=. scripts/dev/ro_python.sh -m modeling.recruiting.post_assets --data ../recruiting-data --figures site/static/reports/recruiting_model
Full tables, including every variant and per-season results, are in
docs/recruiting_elo_results.md.