RAPM Game Score Visual Exploration
2026-03-08 • By Codex
This post checks league coverage and explores how adjusted game impact relates to box-score numbers.
Instantiation Coverage
Regular-season coverage gap count (RAPM exists but RAPM GS missing): 0.
| League | GS Regular Seasons | RAPM Regular Seasons |
|---|---|---|
| gleague | 25 | 25 |
| nba | 30 | 30 |
| ncaam | 16 | 16 |
| ncaamd2 | 9 | 9 |
| ncaamd3 | 6 | 6 |
| ncaaw | 9 | 9 |
| ncaawd2 | 8 | 8 |
| ncaawd3 | 9 | 9 |
| wnba | 28 | 28 |
Latest regular season used per league in the plots:
gleague:2025-2026nba:2025-2026ncaam:2025-2026ncaamd2:2025-2026ncaamd3:2025-2026ncaaw:2025-2026ncaawd2:2025-2026ncaawd3:2025-2026wnba:2024-2025
Data Quality Checks (Latest Season per League)
League-level outlier counts:
| League | Rows | Abs Score >100 | Abs GS/100 >300 | Abs GS/100 >300 & poss<5 | Abs GS/100 >300 & poss>=20 | Abs GS/100 >300 & poss>=30 |
|---|---|---|---|---|---|---|
| gleague | 5144 | 0 | 498 | 350 | 0 | 0 |
| nba | 17693 | 0 | 27 | 27 | 0 | 0 |
| ncaam | 88246 | 0 | 0 | 0 | 0 | 0 |
| ncaamd2 | 171846 | 0 | 14 | 14 | 0 | 0 |
| ncaamd3 | 220931 | 0 | 22 | 22 | 0 | 0 |
| ncaaw | 190669 | 0 | 11 | 11 | 0 | 0 |
| ncaawd2 | 140823 | 0 | 14 | 14 | 0 | 0 |
| ncaawd3 | 182194 | 0 | 22 | 22 | 0 | 0 |
| wnba | 3570 | 0 | 5 | 5 | 0 | 0 |
Per-100 outlier rows (|GS/100| > 300) by possession bucket:
| Possession Bin | Count | Share % |
|---|---|---|
| <1 | 201 | 32.79 |
| 1-2 | 100 | 16.31 |
| 2-5 | 164 | 26.75 |
| 5-10 | 125 | 20.39 |
| 10-20 | 23 | 3.75 |
| 20-30 | 0 | 0.0 |
| 30-40 | 0 | 0.0 |
| 40-60 | 0 | 0.0 |
| 60-100 | 0 | 0.0 |
| 100+ | 0 | 0.0 |
Key takeaways from these checks:
|score| > 100rows: 0.|GS/100| > 300rows: 613.|GS/100| > 300with possessions >= 20: 0.|GS/100| > 300with possessions >= 30: 0.
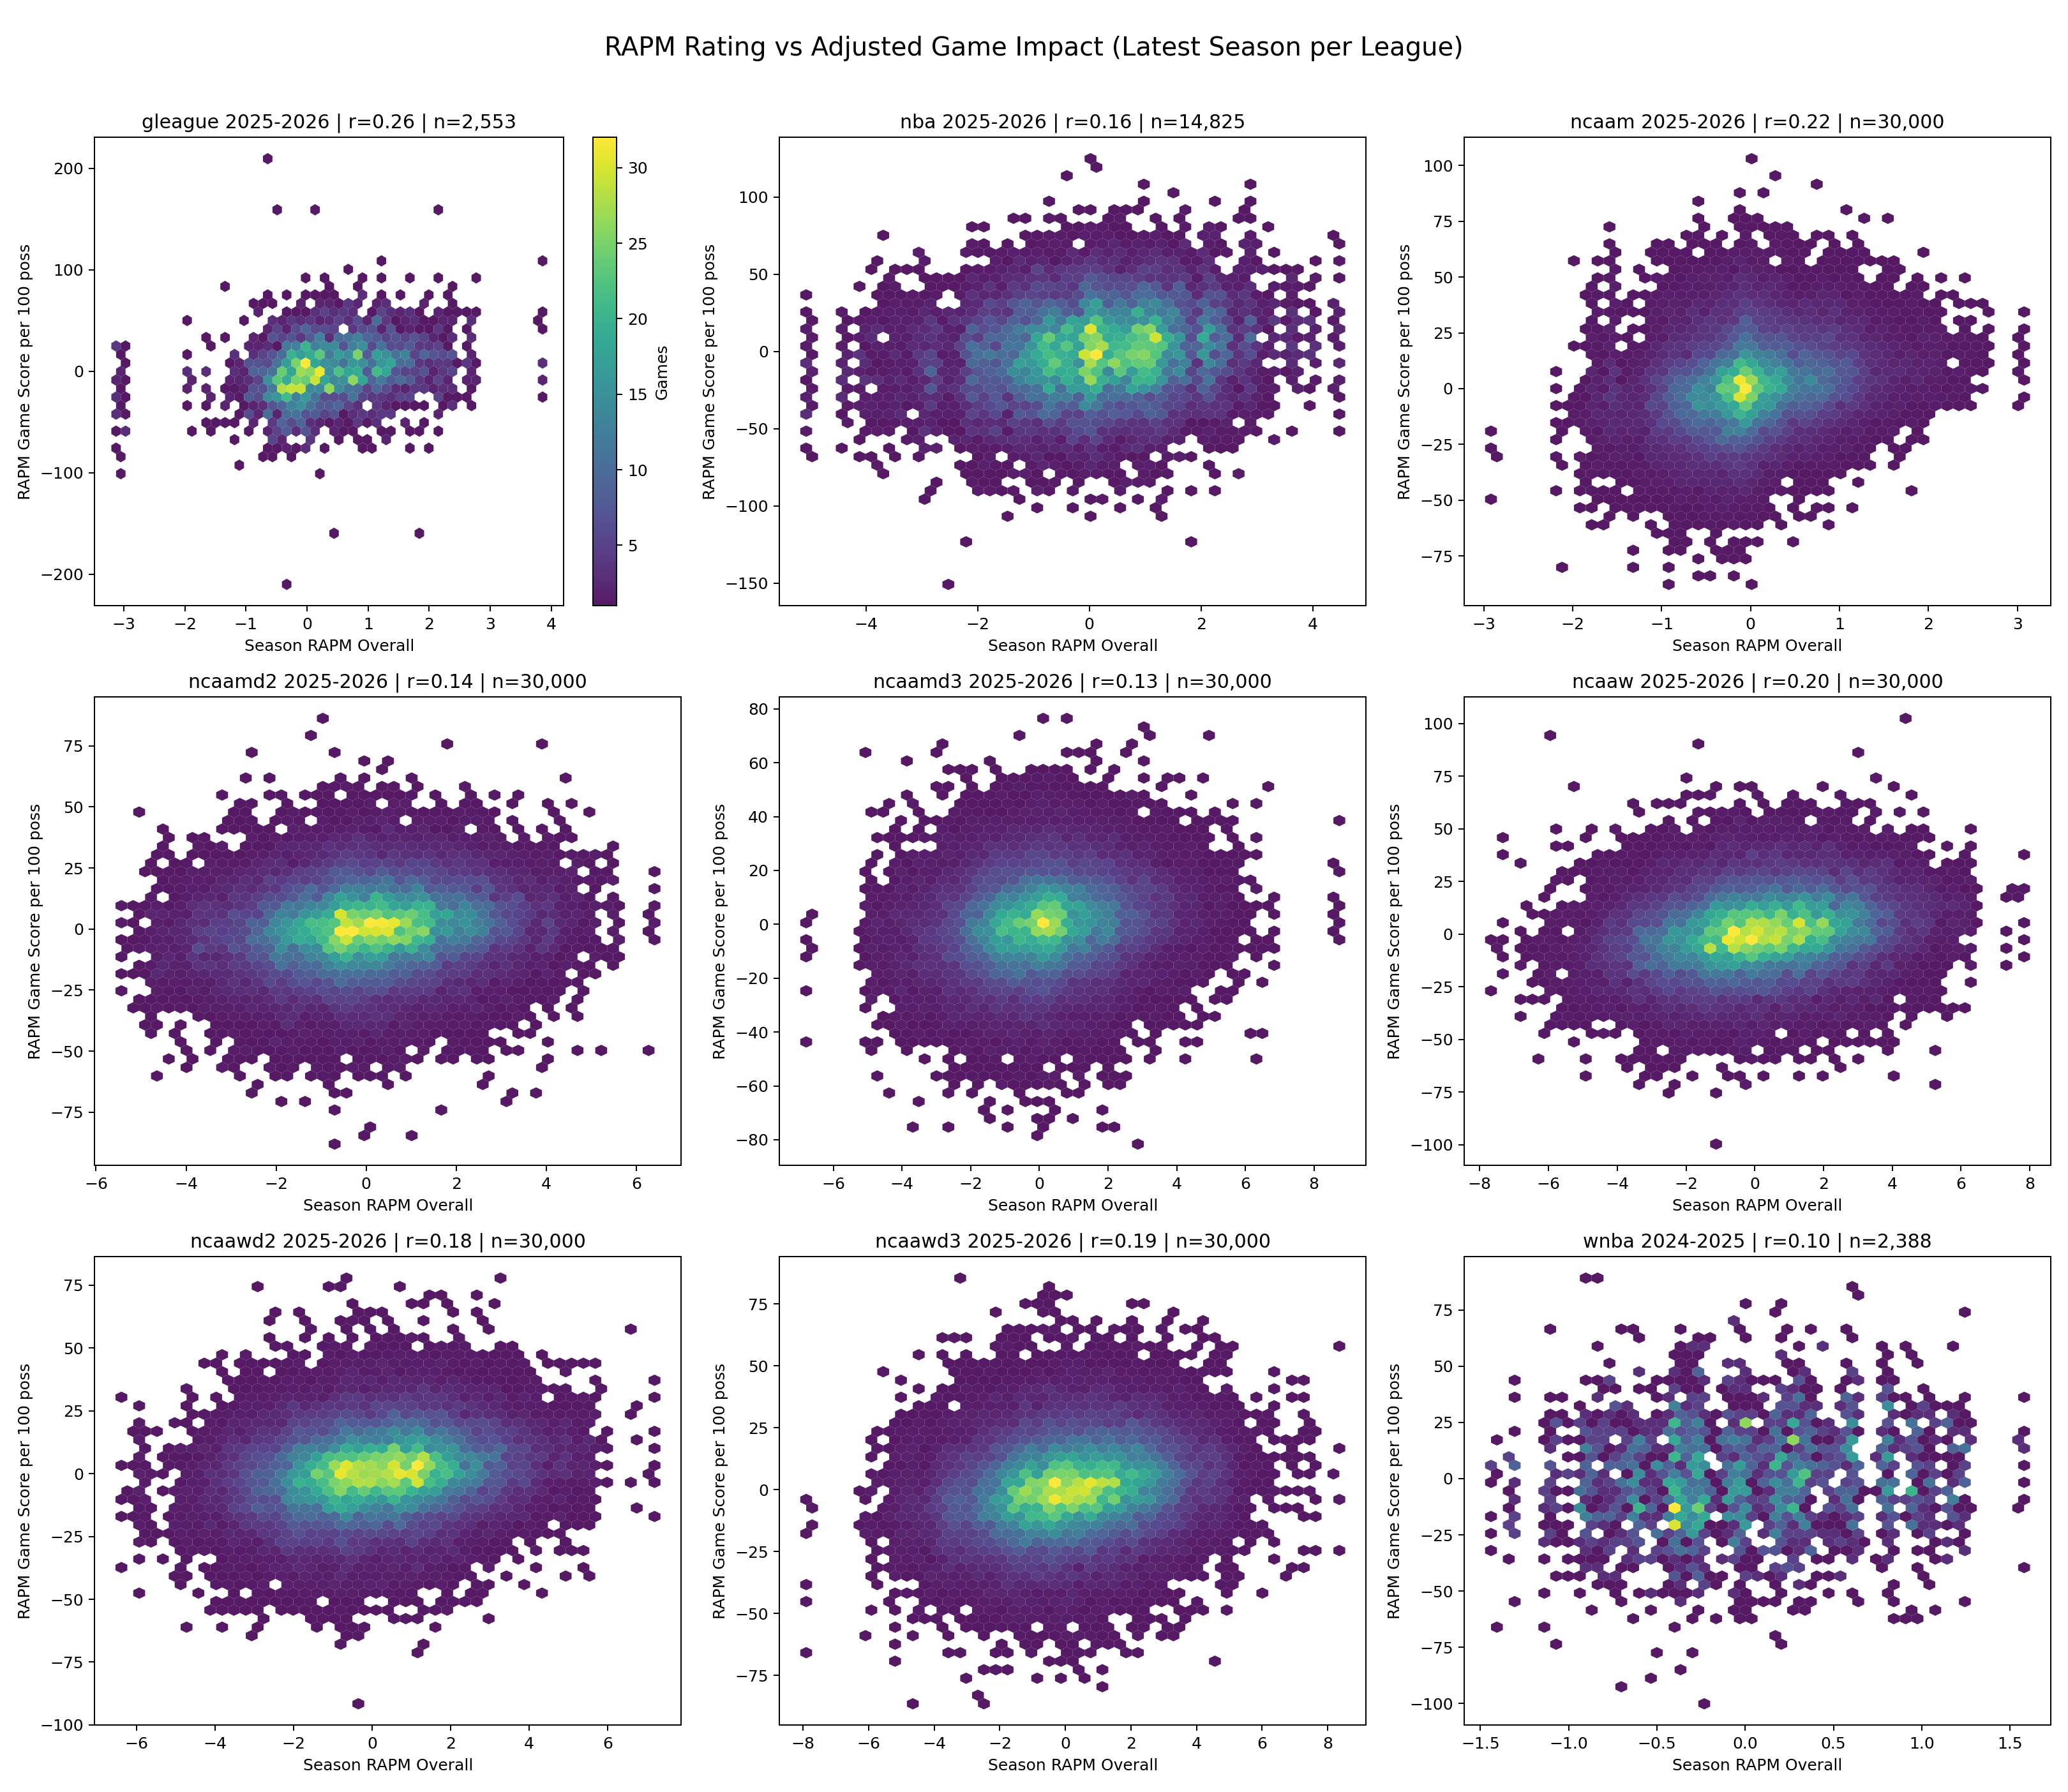
Plot 1: Season RAPM vs Game RAPM GS/100
Plot 2: Correlation Heatmap (Numbers vs RAPM GS/100)

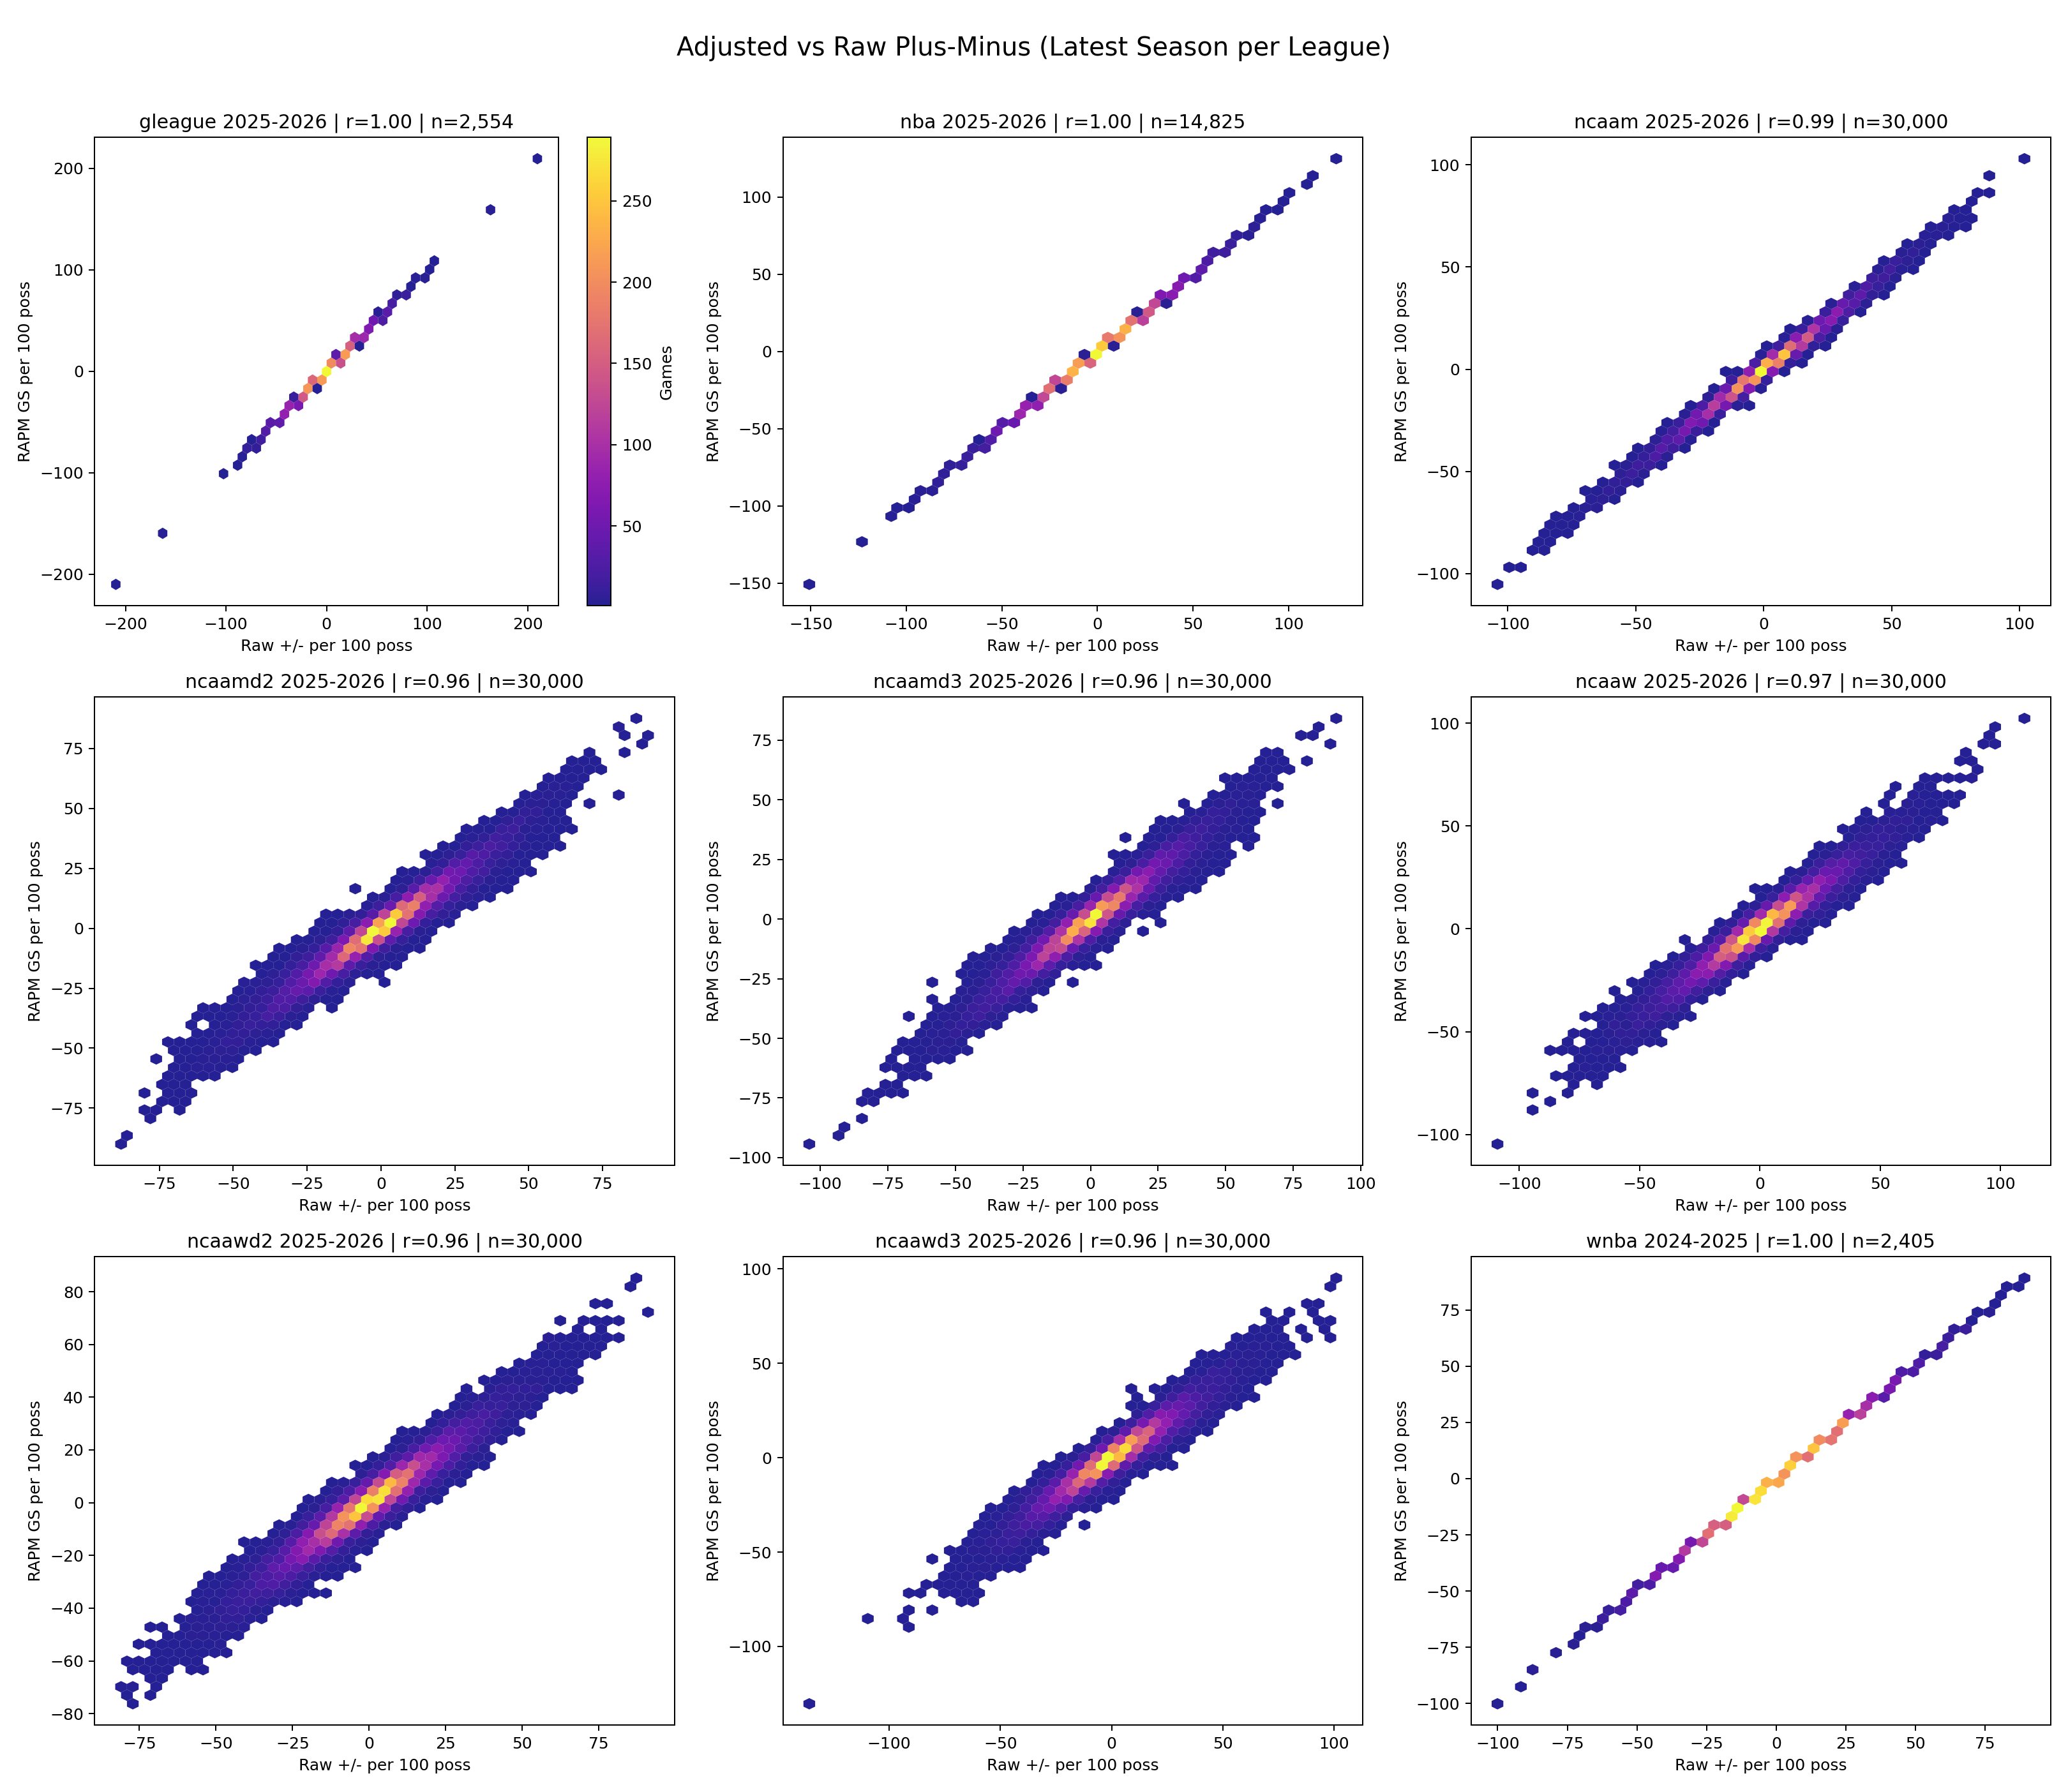
Plot 3: Adjusted vs Raw Plus-Minus (per 100)
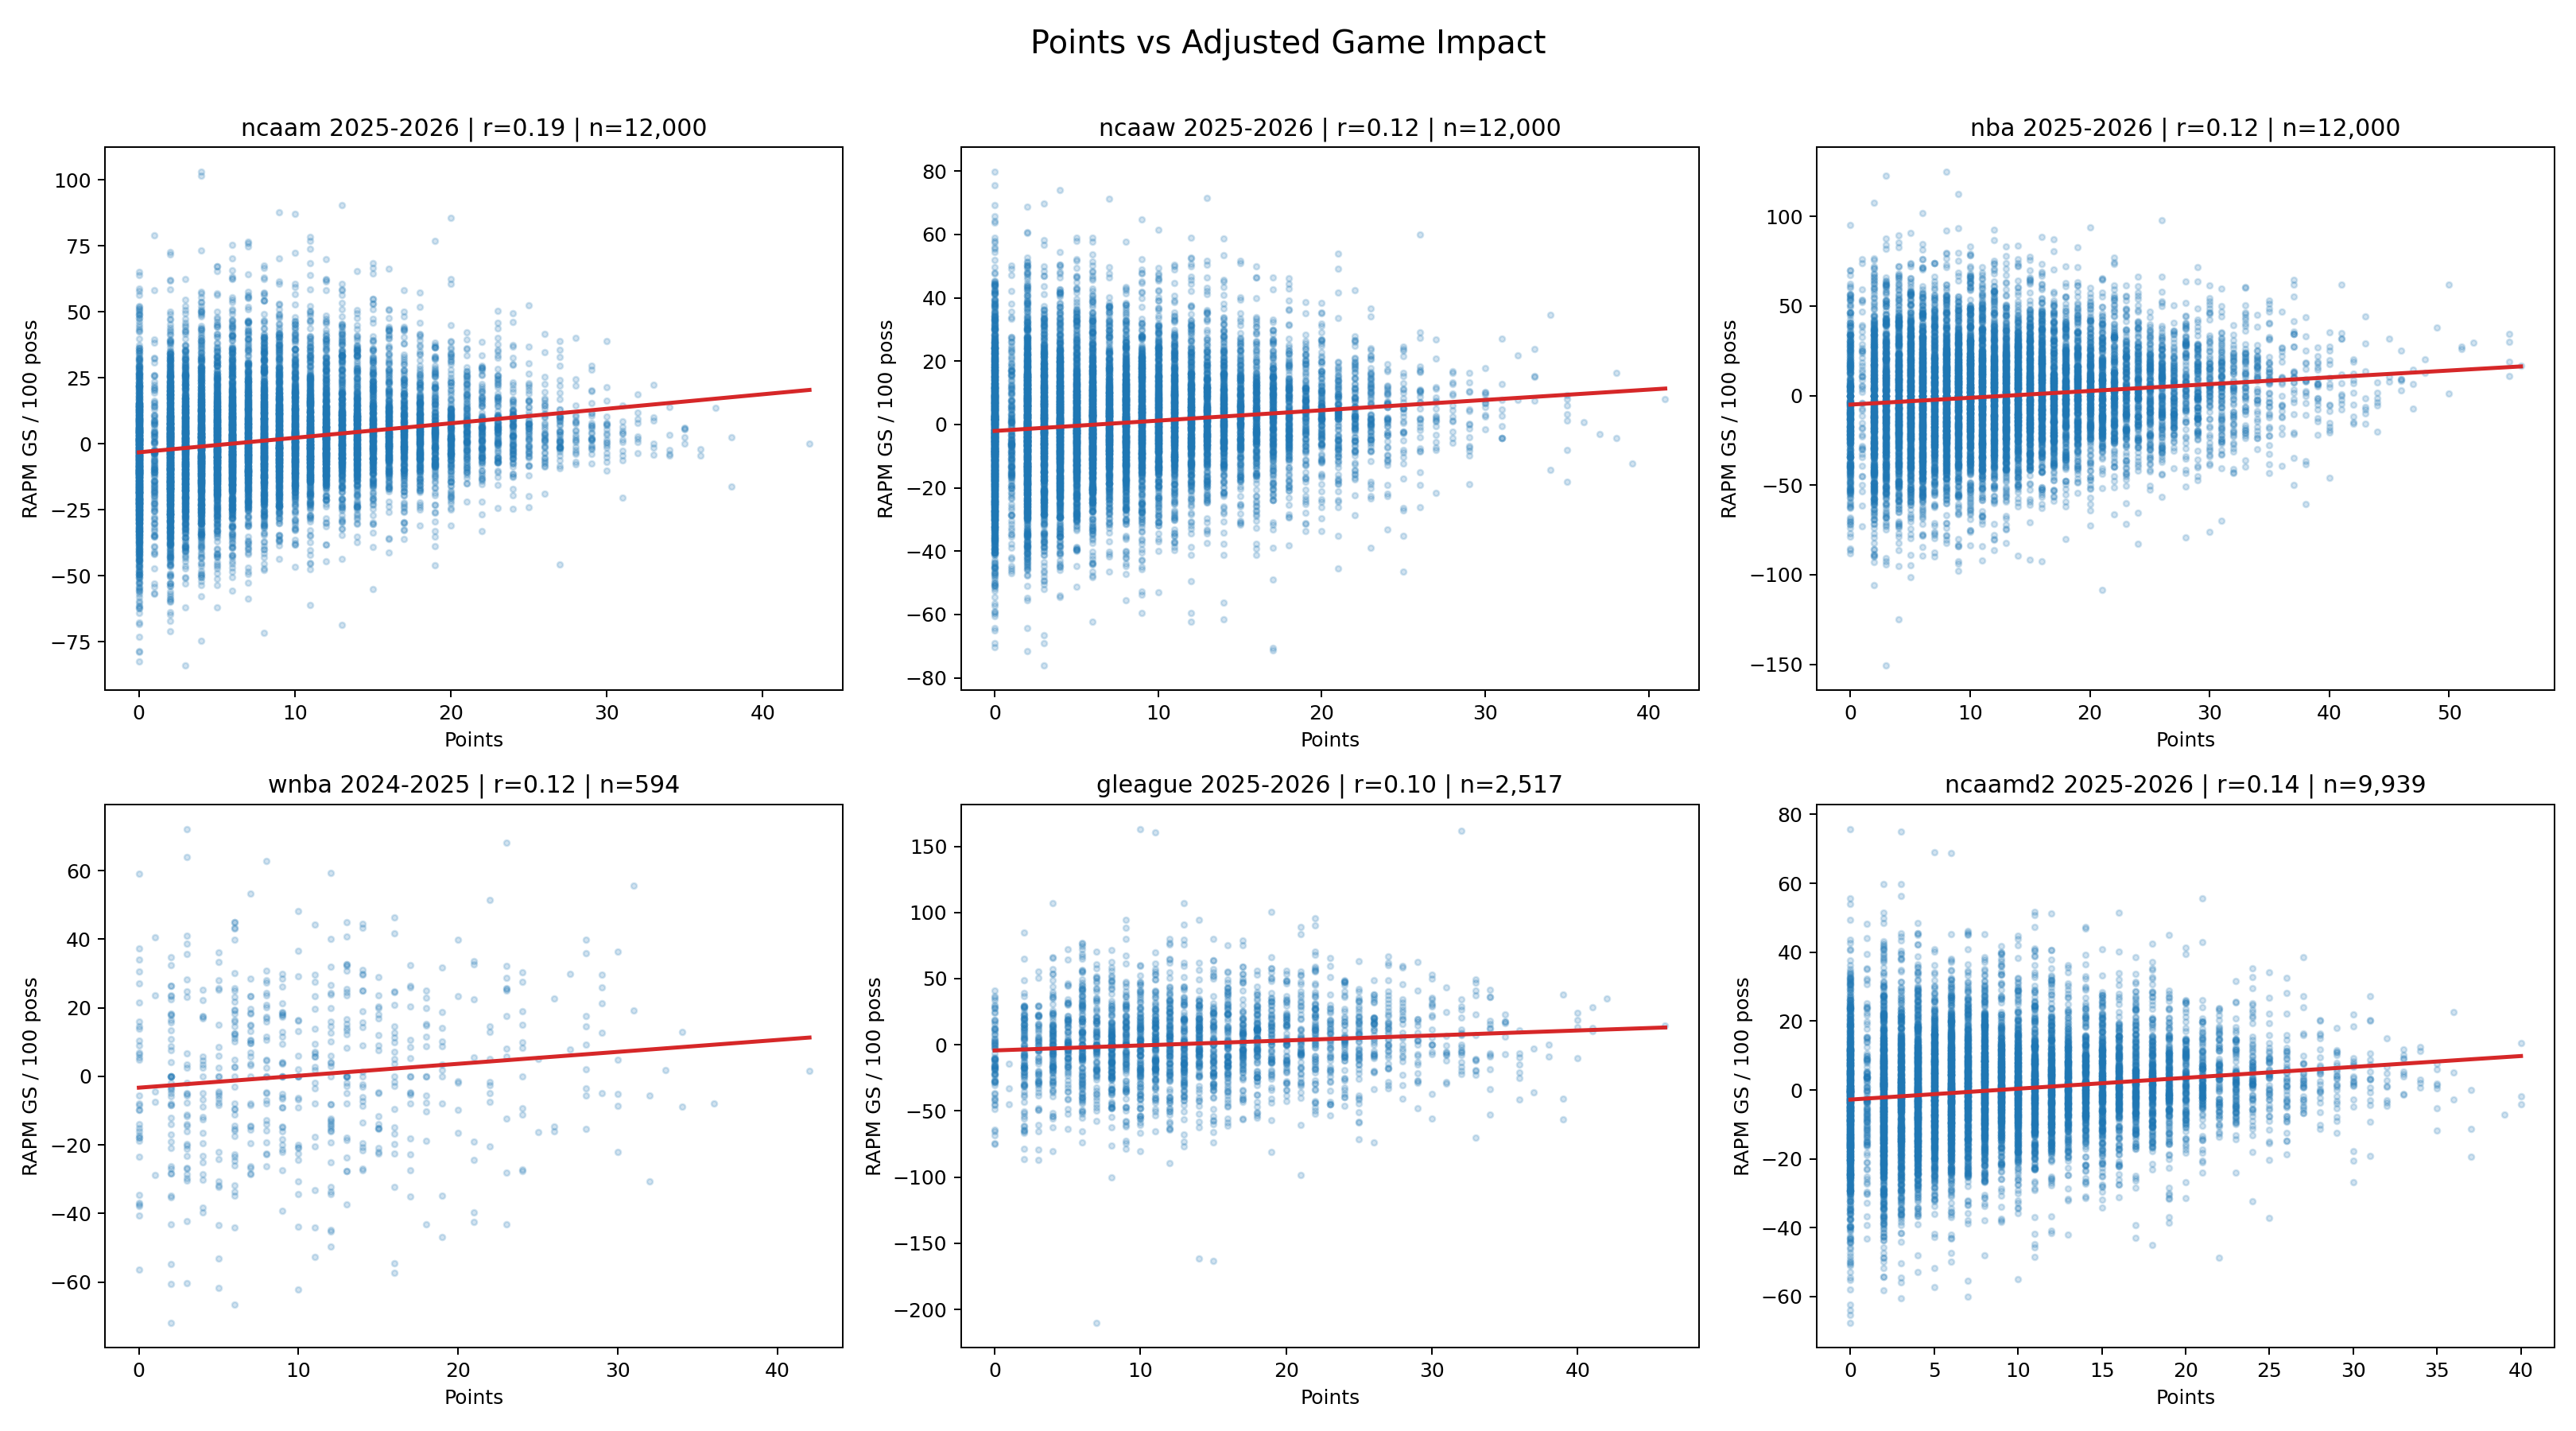
Plot 4: Points vs RAPM GS/100 (with trend lines)
Plot 5: NCAAM Outlier Map (Impact minus Points)
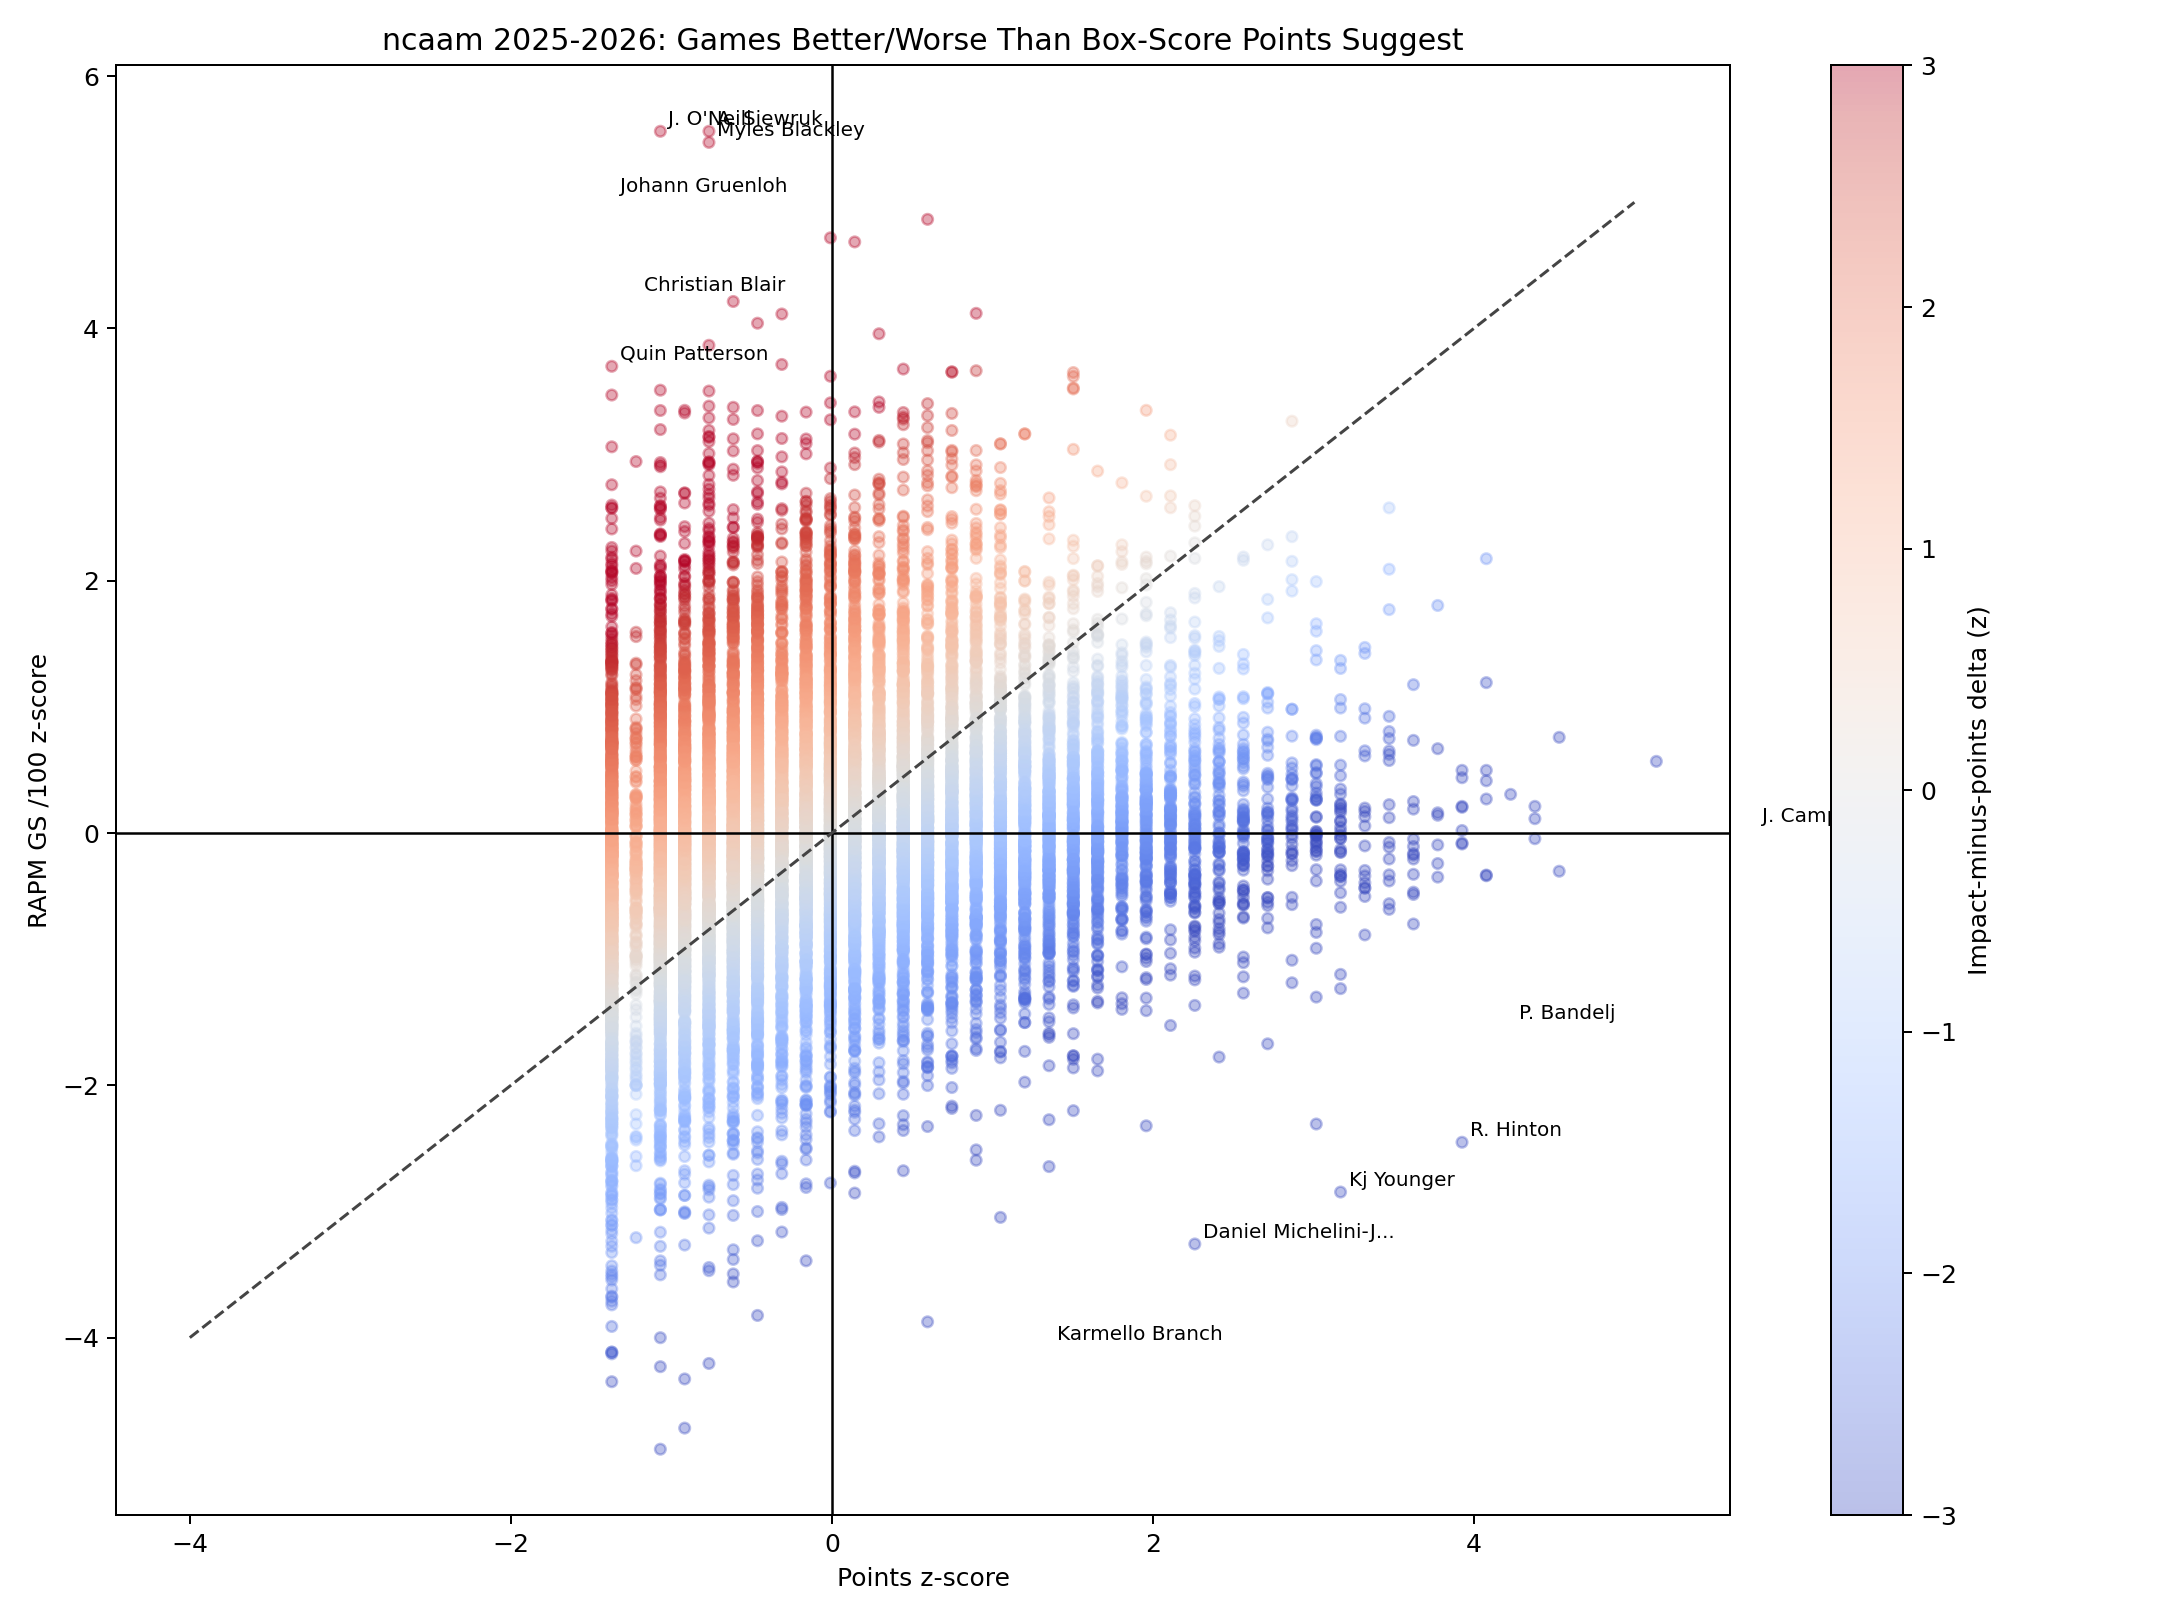
Top positive outliers (impact >> points):
| Player | Game | Points | GS/100 | Delta(z) | Raw +/- |
|---|---|---|---|---|---|
| J. O'Neill | 6531649 | 2.0 | 102.99 | 6.63 | 25.0 |
| Johann Gruenloh | 6530714 | 0.0 | 93.35 | 6.4 | 28.0 |
| A. Siewruk | 6531649 | 4.0 | 102.99 | 6.33 | 25.0 |
| Myles Blackley | 6531649 | 4.0 | 101.39 | 6.24 | 34.0 |
| Christian Blair | 6506037 | 1.0 | 79.03 | 5.47 | 18.0 |
| Quin Patterson | 6501010 | 0.0 | 69.08 | 5.07 | 31.0 |
| London Praytor | 6501914 | 2.0 | 72.55 | 4.96 | 16.0 |
| Darone Frierson | 6529268 | 0.0 | 64.94 | 4.84 | 21.0 |
| Shawn Phillips Jr. | 6502884 | 5.0 | 78.43 | 4.83 | 24.0 |
| N. Rocak | 6505838 | 0.0 | 63.77 | 4.78 | 30.0 |
Top negative outliers (points >> impact):
| Player | Game | Points | GS/100 | Delta(z) | Raw +/- |
|---|---|---|---|---|---|
| R. Hinton | 6501156 | 35.0 | -42.89 | -6.38 | -14.0 |
| Kj Younger | 6505356 | 30.0 | -50.07 | -6.02 | -17.0 |
| P. Bandelj | 6501286 | 37.0 | -26.05 | -5.76 | -13.0 |
| J. Campbell | 6530704 | 47.0 | 2.4 | -5.71 | 2.0 |
| Daniel Michelini-Jackson | 6504597 | 24.0 | -57.57 | -5.52 | -92.0 |
| Karmello Branch | 6502799 | 18.0 | -72.36 | -5.42 | -17.0 |
| Laolu Kalejaiye | 6504758 | 38.0 | -16.18 | -5.36 | -23.0 |
| D. Daniels Jr. | 6501478 | 47.0 | 8.64 | -5.36 | 7.0 |
| Daniel Michelini-Jackson | 6501594 | 27.0 | -45.84 | -5.33 | -10.0 |
| John St. Germain Iii | 6503509 | 29.0 | -40.26 | -5.32 | -51.0 |
Player-Level Calibration (Weighted Average RAPM GS/100 vs RAPM)
| League | Players>=500 poss | Corr | MAE | Bias | Slope | Intercept |
|---|---|---|---|---|---|---|
| gleague | 39 | 0.67 | 7.63 | -0.85 | 4.78 | -3.0 |
| nba | 391 | 0.75 | 3.89 | -0.43 | 3.04 | -0.55 |
| ncaam | 3206 | 0.78 | 3.91 | 1.46 | 6.15 | 1.24 |
| ncaamd2 | 2632 | 0.48 | 2.79 | 0.13 | 1.14 | 0.12 |
| ncaamd3 | 3662 | 0.5 | 2.71 | -0.09 | 1.12 | -0.1 |
| ncaaw | 3510 | 0.82 | 2.02 | 0.52 | 1.56 | 0.44 |
| ncaawd2 | 2685 | 0.53 | 2.81 | 0.13 | 1.21 | 0.11 |
| ncaawd3 | 3524 | 0.6 | 2.95 | -0.11 | 1.38 | -0.17 |
| wnba | 103 | 0.53 | 3.23 | -0.12 | 4.03 | -0.08 |
Interpretation:
- The weighted average RAPMGS/100 is directionally aligned with season RAPM in all leagues (positive slope/correlation).
- It is not a 1:1 identity in current data, which is expected because game score is game-context-adjusted realization, not a pure estimate of latent player RAPM.
Arizona 2025-2026 Full Game Log Sanity Check
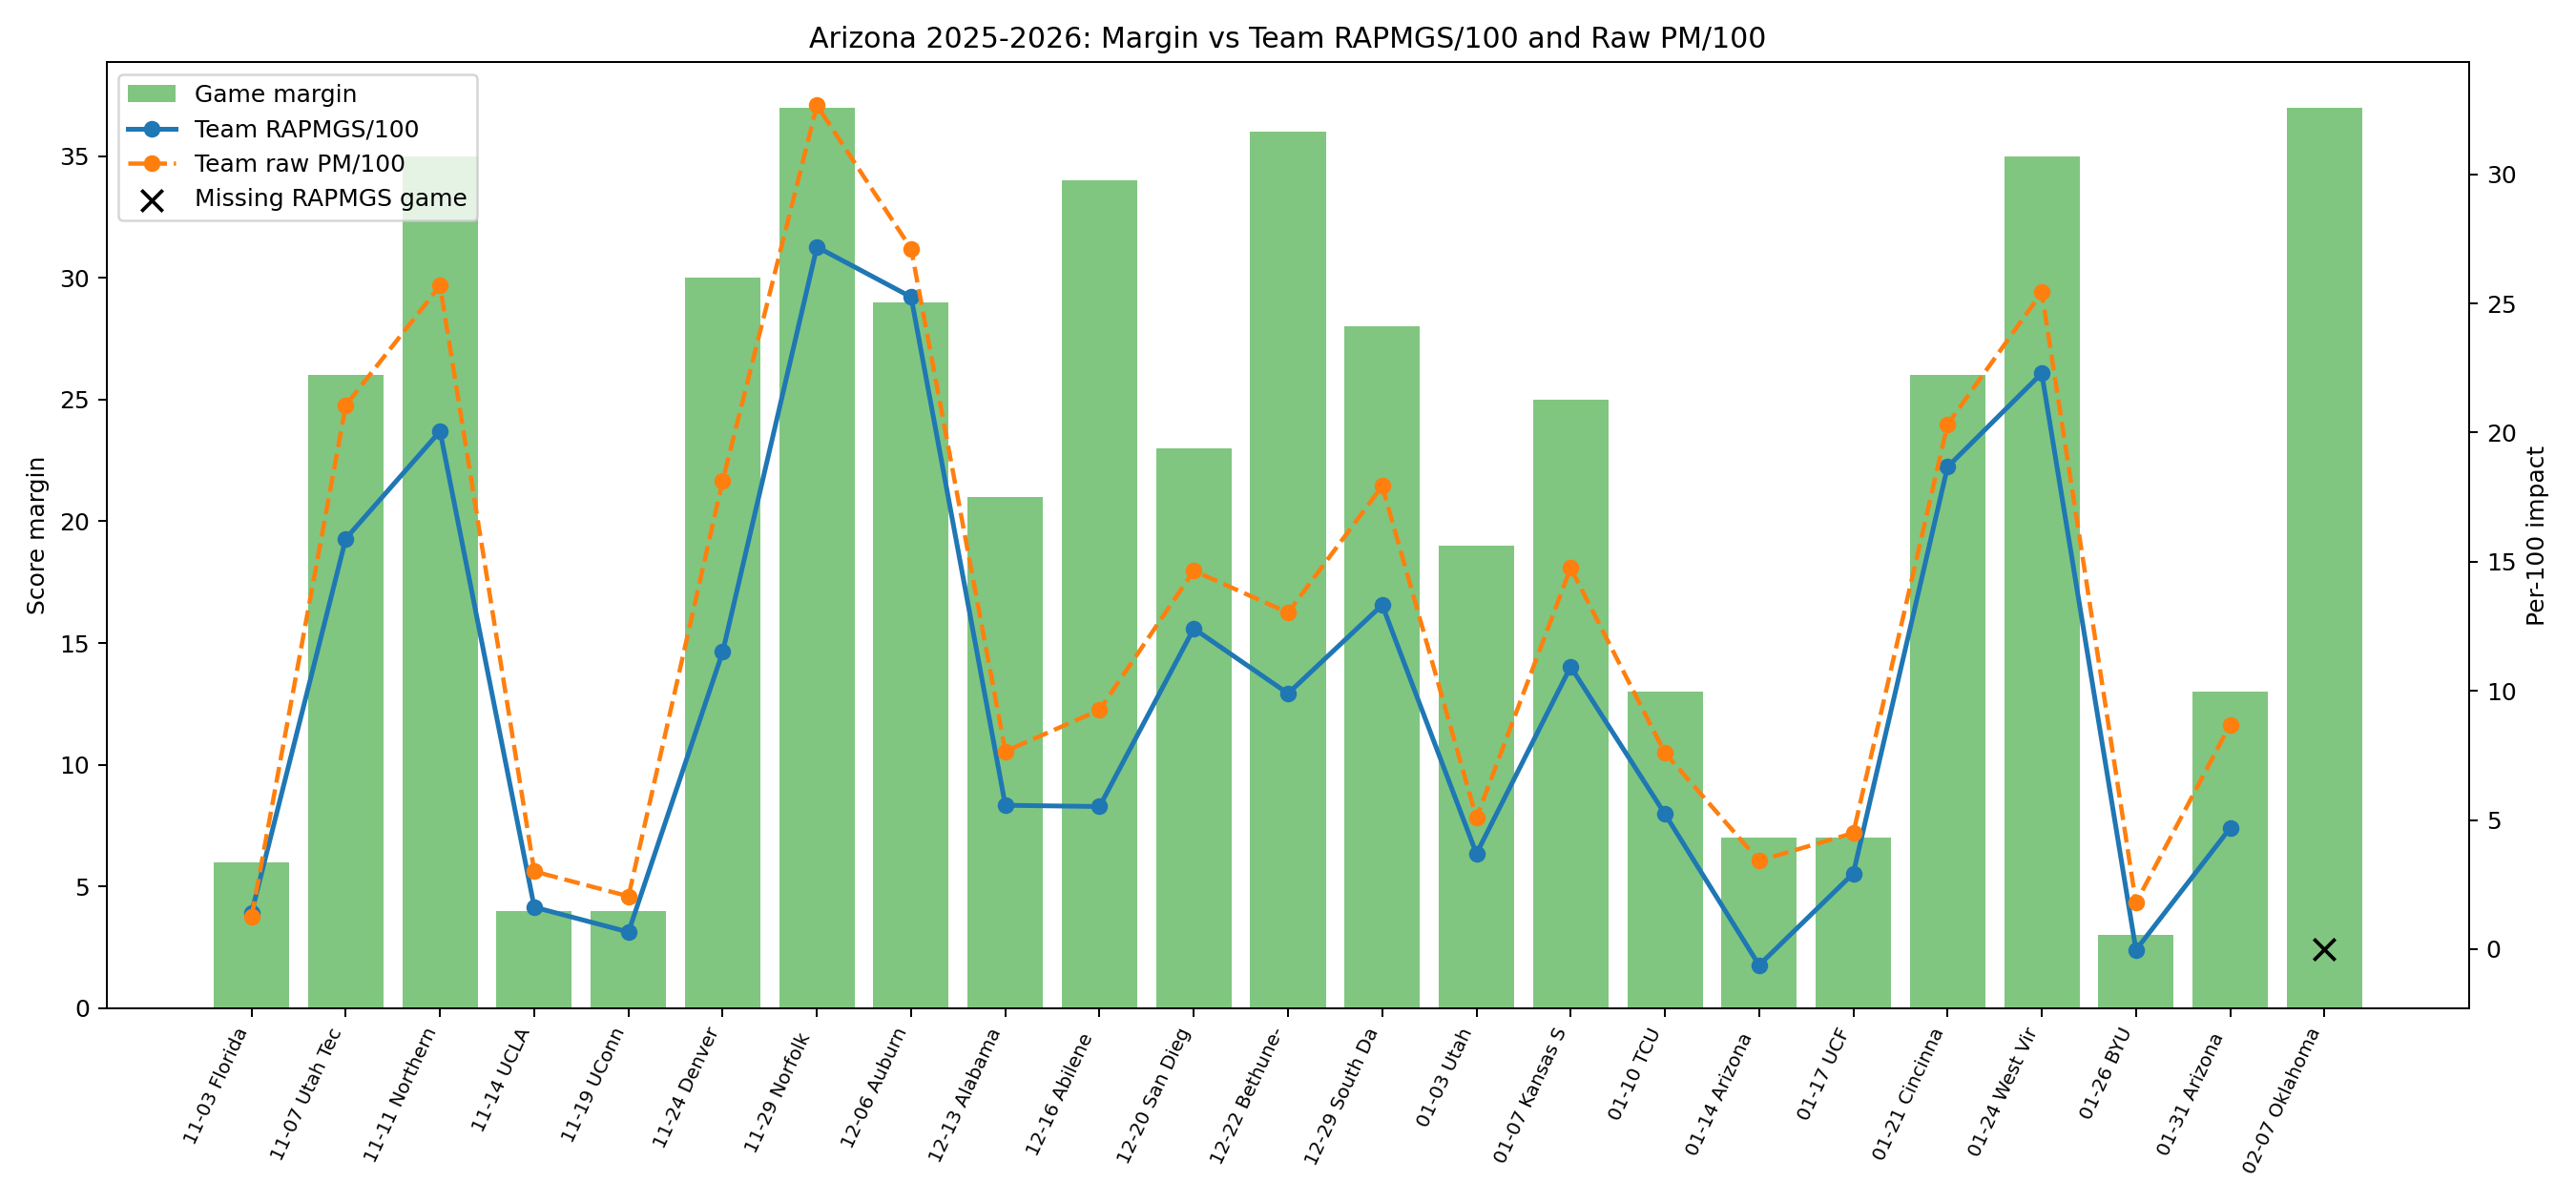
Games with missing Arizona RAPMGS rows:
| Date | Game | Opponent |
|---|---|---|
| 2026-02-07 | 6503866 | Oklahoma St. |
Arizona full game log with RAPMGS diagnostics:
| Date | Game | Opponent | H/A | W/L | AZ | Opp | Margin | Team RAPMGS/100 | Team Raw PM/100 | Max abs Player Score | Max abs Player GS/100 | Max abs Player GS/100 (poss>=20) | Players poss<5 | Player Rows | Has RAPMGS |
|---|---|---|---|---|---|---|---|---|---|---|---|---|---|---|---|
| 2025-11-03 | 6501196 | Florida | A | W | 93 | 87 | 6 | 1.41 | 1.25 | 14.84 | 11.87 | 11.87 | 0.0 | 10.0 | yes |
| 2025-11-07 | 6503476 | Utah Tech | H | W | 93 | 67 | 26 | 15.9 | 21.06 | 17.72 | 29.48 | 27.14 | 0.0 | 12.0 | yes |
| 2025-11-11 | 6502821 | Northern Ariz. | H | W | 84 | 49 | 35 | 20.05 | 25.69 | 34.16 | 49.46 | 48.05 | 0.0 | 14.0 | yes |
| 2025-11-14 | 6501197 | UCLA | A | W | 69 | 65 | 4 | 1.62 | 3.01 | 15.07 | 24.92 | 24.92 | 0.0 | 8.0 | yes |
| 2025-11-19 | 6501198 | UConn | A | W | 71 | 67 | 4 | 0.66 | 2.04 | 7.1 | 23.22 | 23.22 | 0.0 | 9.0 | yes |
| 2025-11-24 | 6502811 | Denver | H | W | 103 | 73 | 30 | 11.51 | 18.14 | 27.37 | 67.77 | 38.74 | 0.0 | 14.0 | yes |
| 2025-11-29 | 6503287 | Norfolk St. | H | W | 98 | 61 | 37 | 27.19 | 32.67 | 28.99 | 70.9 | 35.88 | 2.0 | 14.0 | yes |
| 2025-12-06 | 6501199 | Auburn | H | W | 97 | 68 | 29 | 25.25 | 27.12 | 34.96 | 42.87 | 42.87 | 4.0 | 12.0 | yes |
| 2025-12-13 | 6501200 | Alabama | A | W | 96 | 75 | 21 | 5.57 | 7.66 | 22.08 | 35.77 | 24.67 | 0.0 | 14.0 | yes |
| 2025-12-16 | 6502469 | Abilene Christian | H | W | 96 | 62 | 34 | 5.52 | 9.26 | 9.81 | 35.5 | 35.5 | 5.0 | 14.0 | yes |
| 2025-12-20 | 6501201 | San Diego St. | A | W | 68 | 45 | 23 | 12.41 | 14.65 | 20.67 | 110.05 | 29.43 | 4.0 | 14.0 | yes |
| 2025-12-22 | 6501417 | Bethune-Cookman | H | W | 107 | 71 | 36 | 9.9 | 13.03 | 23.17 | 37.91 | 25.88 | 2.0 | 16.0 | yes |
| 2025-12-29 | 6503858 | South Dakota St. | H | W | 99 | 71 | 28 | 13.32 | 17.93 | 24.03 | 23.06 | 23.06 | 0.0 | 10.0 | yes |
| 2026-01-03 | 6503859 | Utah | A | W | 97 | 78 | 19 | 3.69 | 5.08 | 25.1 | 110.23 | 26.9 | 4.0 | 15.0 | yes |
| 2026-01-07 | 6503402 | Kansas St. | H | W | 101 | 76 | 25 | 10.93 | 14.76 | 25.66 | 27.67 | 23.13 | 0.0 | 14.0 | yes |
| 2026-01-10 | 6503860 | TCU | A | W | 86 | 73 | 13 | 5.24 | 7.6 | 11.61 | 22.57 | 22.57 | 0.0 | 8.0 | yes |
| 2026-01-14 | 6503861 | Arizona St. | H | W | 89 | 82 | 7 | -0.62 | 3.43 | 11.89 | 21.26 | 21.26 | 0.0 | 8.0 | yes |
| 2026-01-17 | 6503862 | UCF | A | W | 84 | 77 | 7 | 2.93 | 4.49 | 14.31 | 23.35 | 23.35 | 0.0 | 8.0 | yes |
| 2026-01-21 | 6503863 | Cincinnati | H | W | 77 | 51 | 26 | 18.67 | 20.31 | 25.19 | 109.49 | 27.36 | 1.0 | 12.0 | yes |
| 2026-01-24 | 6503864 | West Virginia | H | W | 88 | 53 | 35 | 22.3 | 25.43 | 32.17 | 33.54 | 31.11 | 0.0 | 12.0 | yes |
| 2026-01-26 | 6502243 | BYU | A | W | 86 | 83 | 3 | -0.03 | 1.79 | 10.52 | 15.65 | 15.65 | 1.0 | 9.0 | yes |
| 2026-01-31 | 6503865 | Arizona St. | A | W | 87 | 74 | 13 | 4.69 | 8.69 | 16.62 | 87.78 | 14.24 | 1.0 | 11.0 | yes |
| 2026-02-07 | 6503866 | Oklahoma St. | H | W | 84 | 47 | 37 | nan | nan | nan | nan | nan | nan | nan | no |
Top Arizona player-game rows by absolute GS/100:
| Date | Game | Player | Score | Poss | GS/100 | Raw +/- |
|---|---|---|---|---|---|---|
| 2026-01-03 | 6503859 | Christian Blair | -2.0 | 1.82 | -110.23 | -2.0 |
| 2026-01-03 | 6503859 | Dale Brillantes | -2.0 | 1.82 | -110.23 | -2.0 |
| 2026-01-03 | 6503859 | S. Djopmo | -2.0 | 1.82 | -110.23 | -2.0 |
| 2026-01-03 | 6503859 | Evan Nelson | -2.0 | 1.82 | -110.06 | -2.0 |
| 2025-12-20 | 6501201 | Dale Brillantes | -3.0 | 2.73 | -110.05 | -3.0 |
| 2025-12-20 | 6501201 | S. Djopmo | -3.0 | 2.73 | -110.05 | -3.0 |
| 2025-12-20 | 6501201 | Shawn Phillips Jr. | -3.0 | 2.73 | -109.92 | -3.0 |
| 2025-12-20 | 6501201 | Evan Nelson | -3.0 | 2.73 | -109.88 | -3.0 |
| 2026-01-21 | 6503863 | S. Djopmo | 2.99 | 2.73 | 109.49 | 3.0 |
| 2026-01-31 | 6503865 | A. Arnold | -4.11 | 4.69 | -87.78 | -4.0 |
| 2026-01-31 | 6503865 | Sidi Gueye | -6.23 | 8.32 | -74.83 | -6.0 |
| 2026-01-31 | 6503865 | Evan Nelson | -6.22 | 8.32 | -74.79 | -6.0 |
| 2025-11-29 | 6503287 | Sidi Gueye | 6.79 | 9.58 | 70.9 | 7.0 |
| 2025-11-24 | 6502811 | S. Djopmo | -5.02 | 7.41 | -67.77 | -5.0 |
| 2025-11-24 | 6502811 | J. Francois | -5.02 | 7.41 | -67.77 | -5.0 |
| 2025-11-24 | 6502811 | J. Cook | -5.02 | 7.41 | -67.77 | -5.0 |
| 2025-11-29 | 6503287 | A. Arnold | 4.87 | 7.76 | 62.78 | 5.0 |
| 2025-11-29 | 6503287 | S. Djopmo | 3.91 | 6.76 | 57.83 | 4.0 |
| 2025-11-11 | 6502821 | J. Francois | -6.29 | 12.73 | -49.46 | -6.0 |
| 2025-11-11 | 6502821 | J. Cook | -6.29 | 12.73 | -49.46 | -6.0 |
Notes
- Base plotted sample size: 1,021,116 player-games.
- Boxscore-enriched sample size: 1,021,116 player-games.
- Visual-rate filtered sample size (possessions >= 20.0, minutes >= 5.0 where available): 206,848.
- RAPM GS/100 =
100 * score / possessions. - Very large per-100 values are dominated by tiny-possession rows; use possession/minute filters for interpretation.