Player Event Elo: Points Created, Points Prevented, and Event Splits
This report introduces a first pass at player event Elo models.
Each player gets two numbers for each event family:
- for_team: contribution to the event happening for the player's team
- against_team: contribution to preventing that event for the opponent
For points, that gives a clean interpretable 2D view:
- Points For Elo = points created for your own team
- Points Prevention Elo = points prevented from the other team
- Points Net Elo = the sum
Important caveat: these are online event decompositions with actual played minutes, not adjusted impact estimates.
They are much more interpretable than the earlier raw Vec2, but they still inherit a lot of team context and are not a replacement for RAPM.
Current defaults: learning_rate=0.08, shrink=0.004.
Main Read
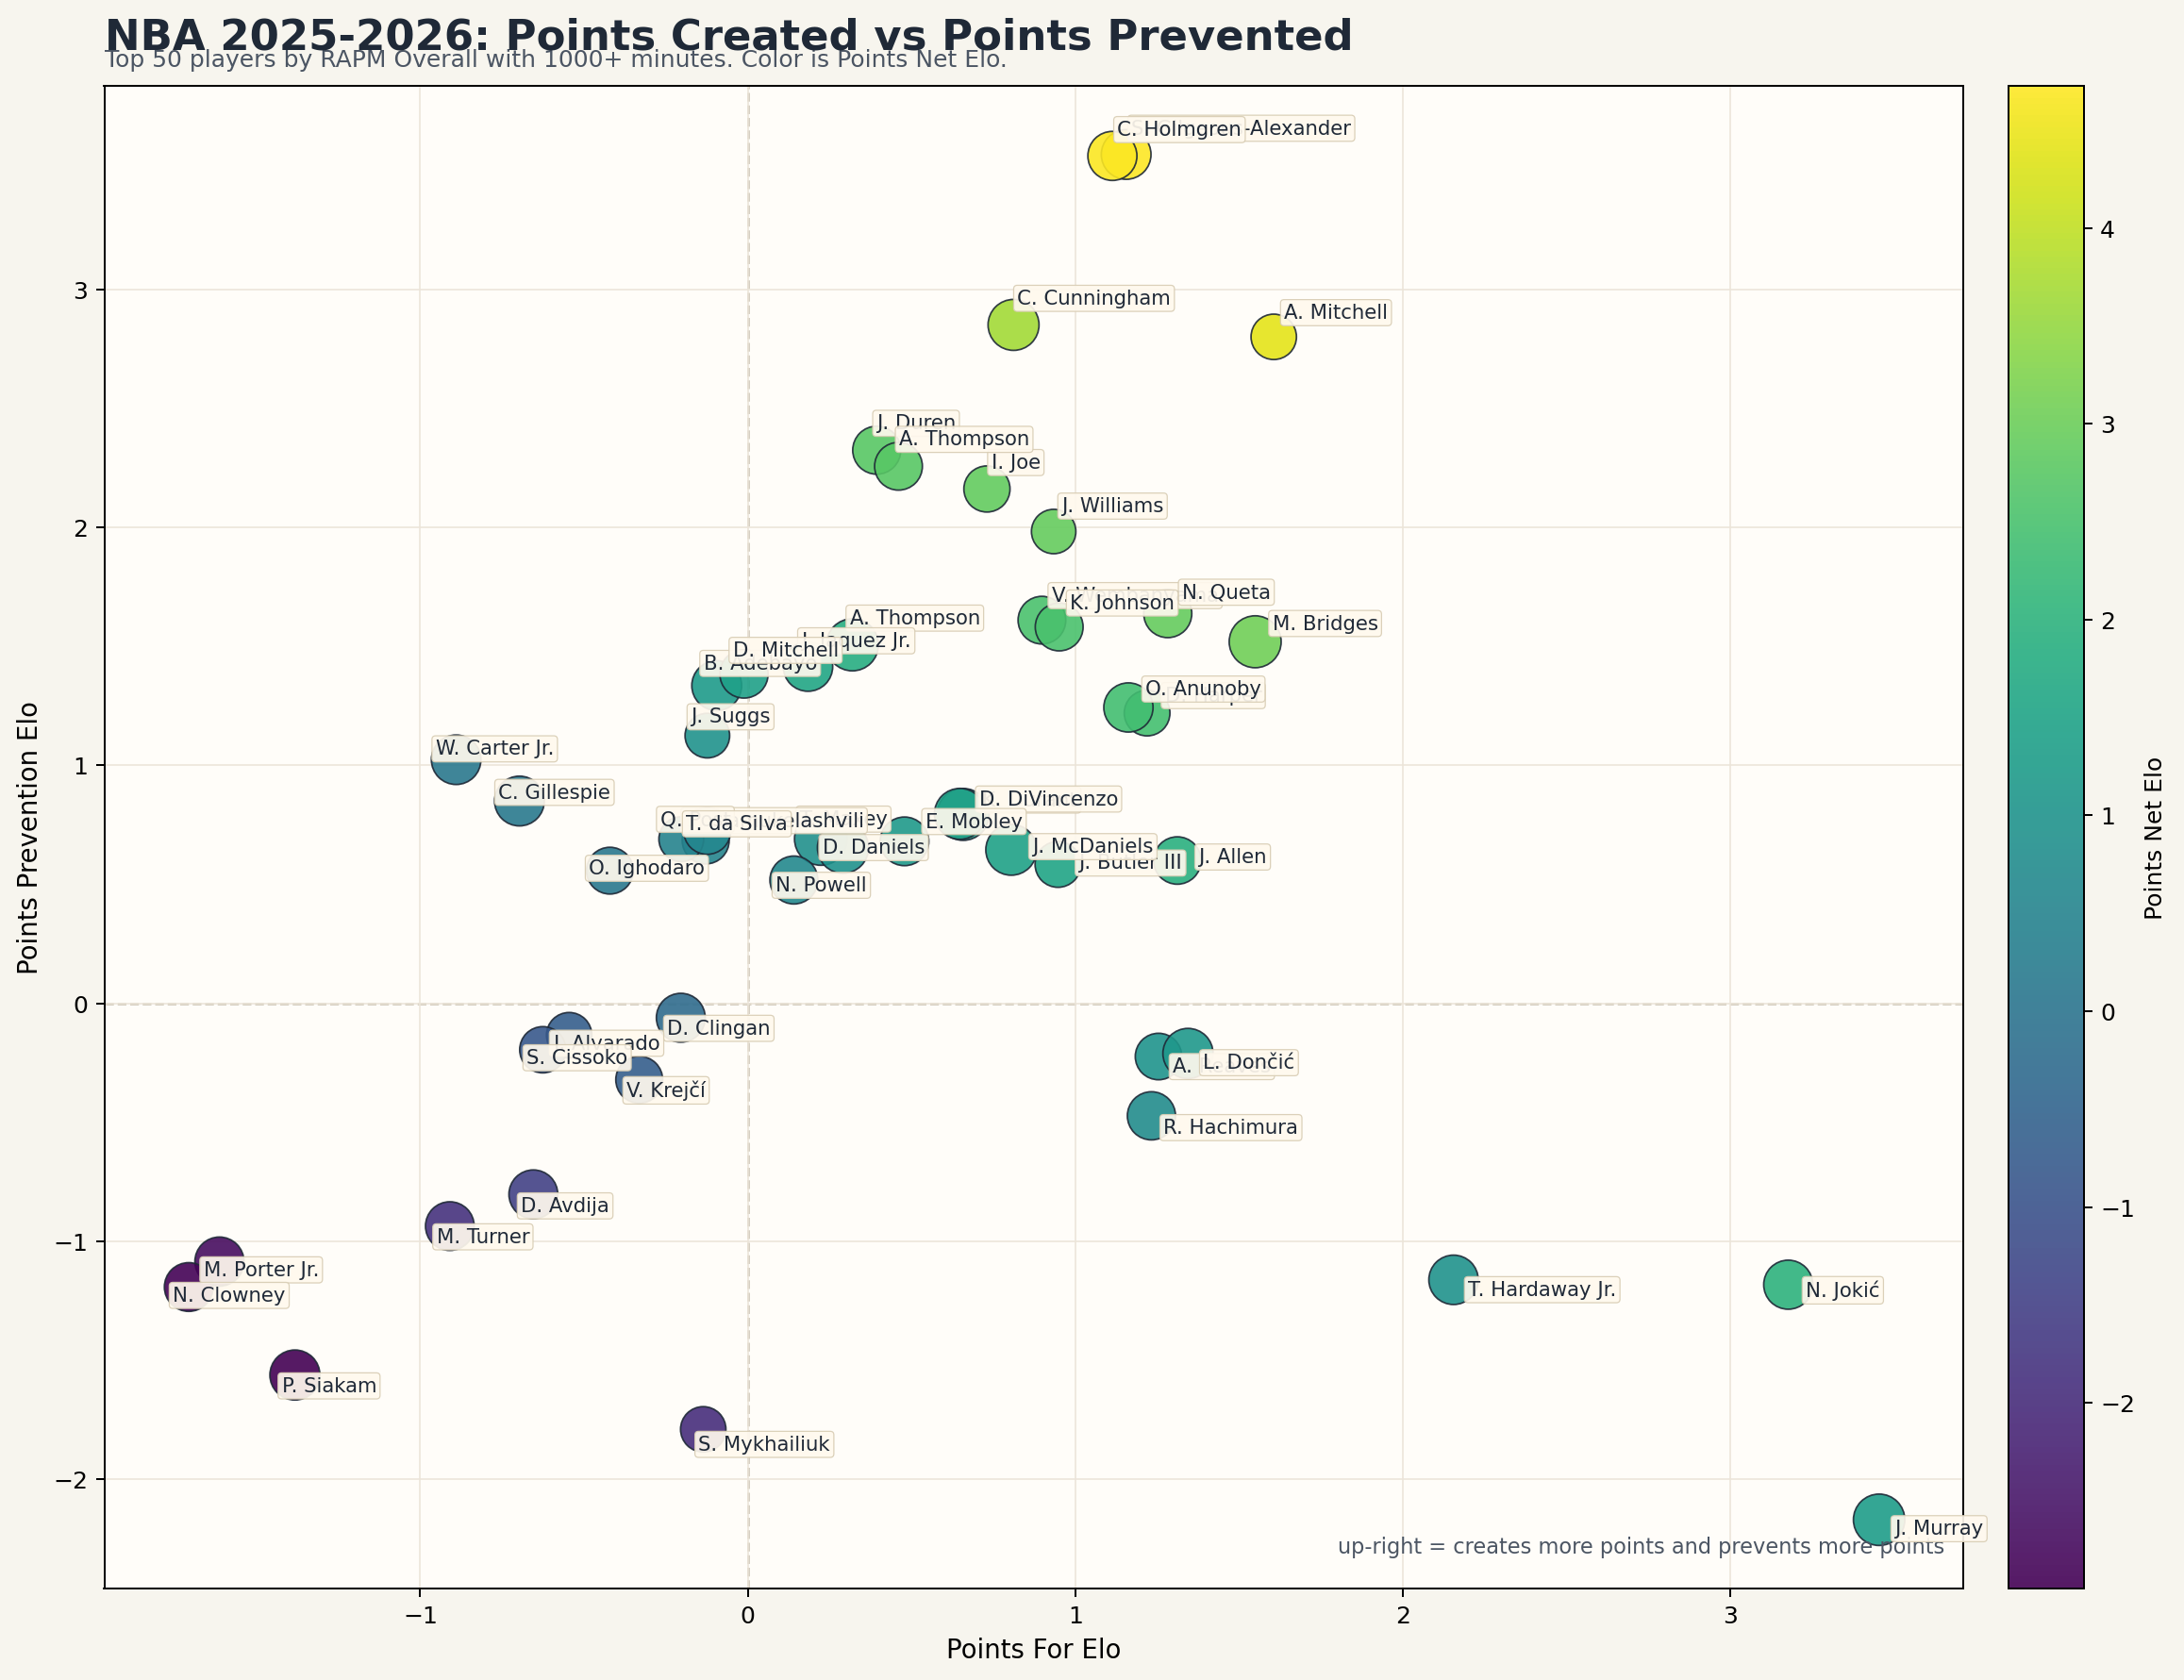
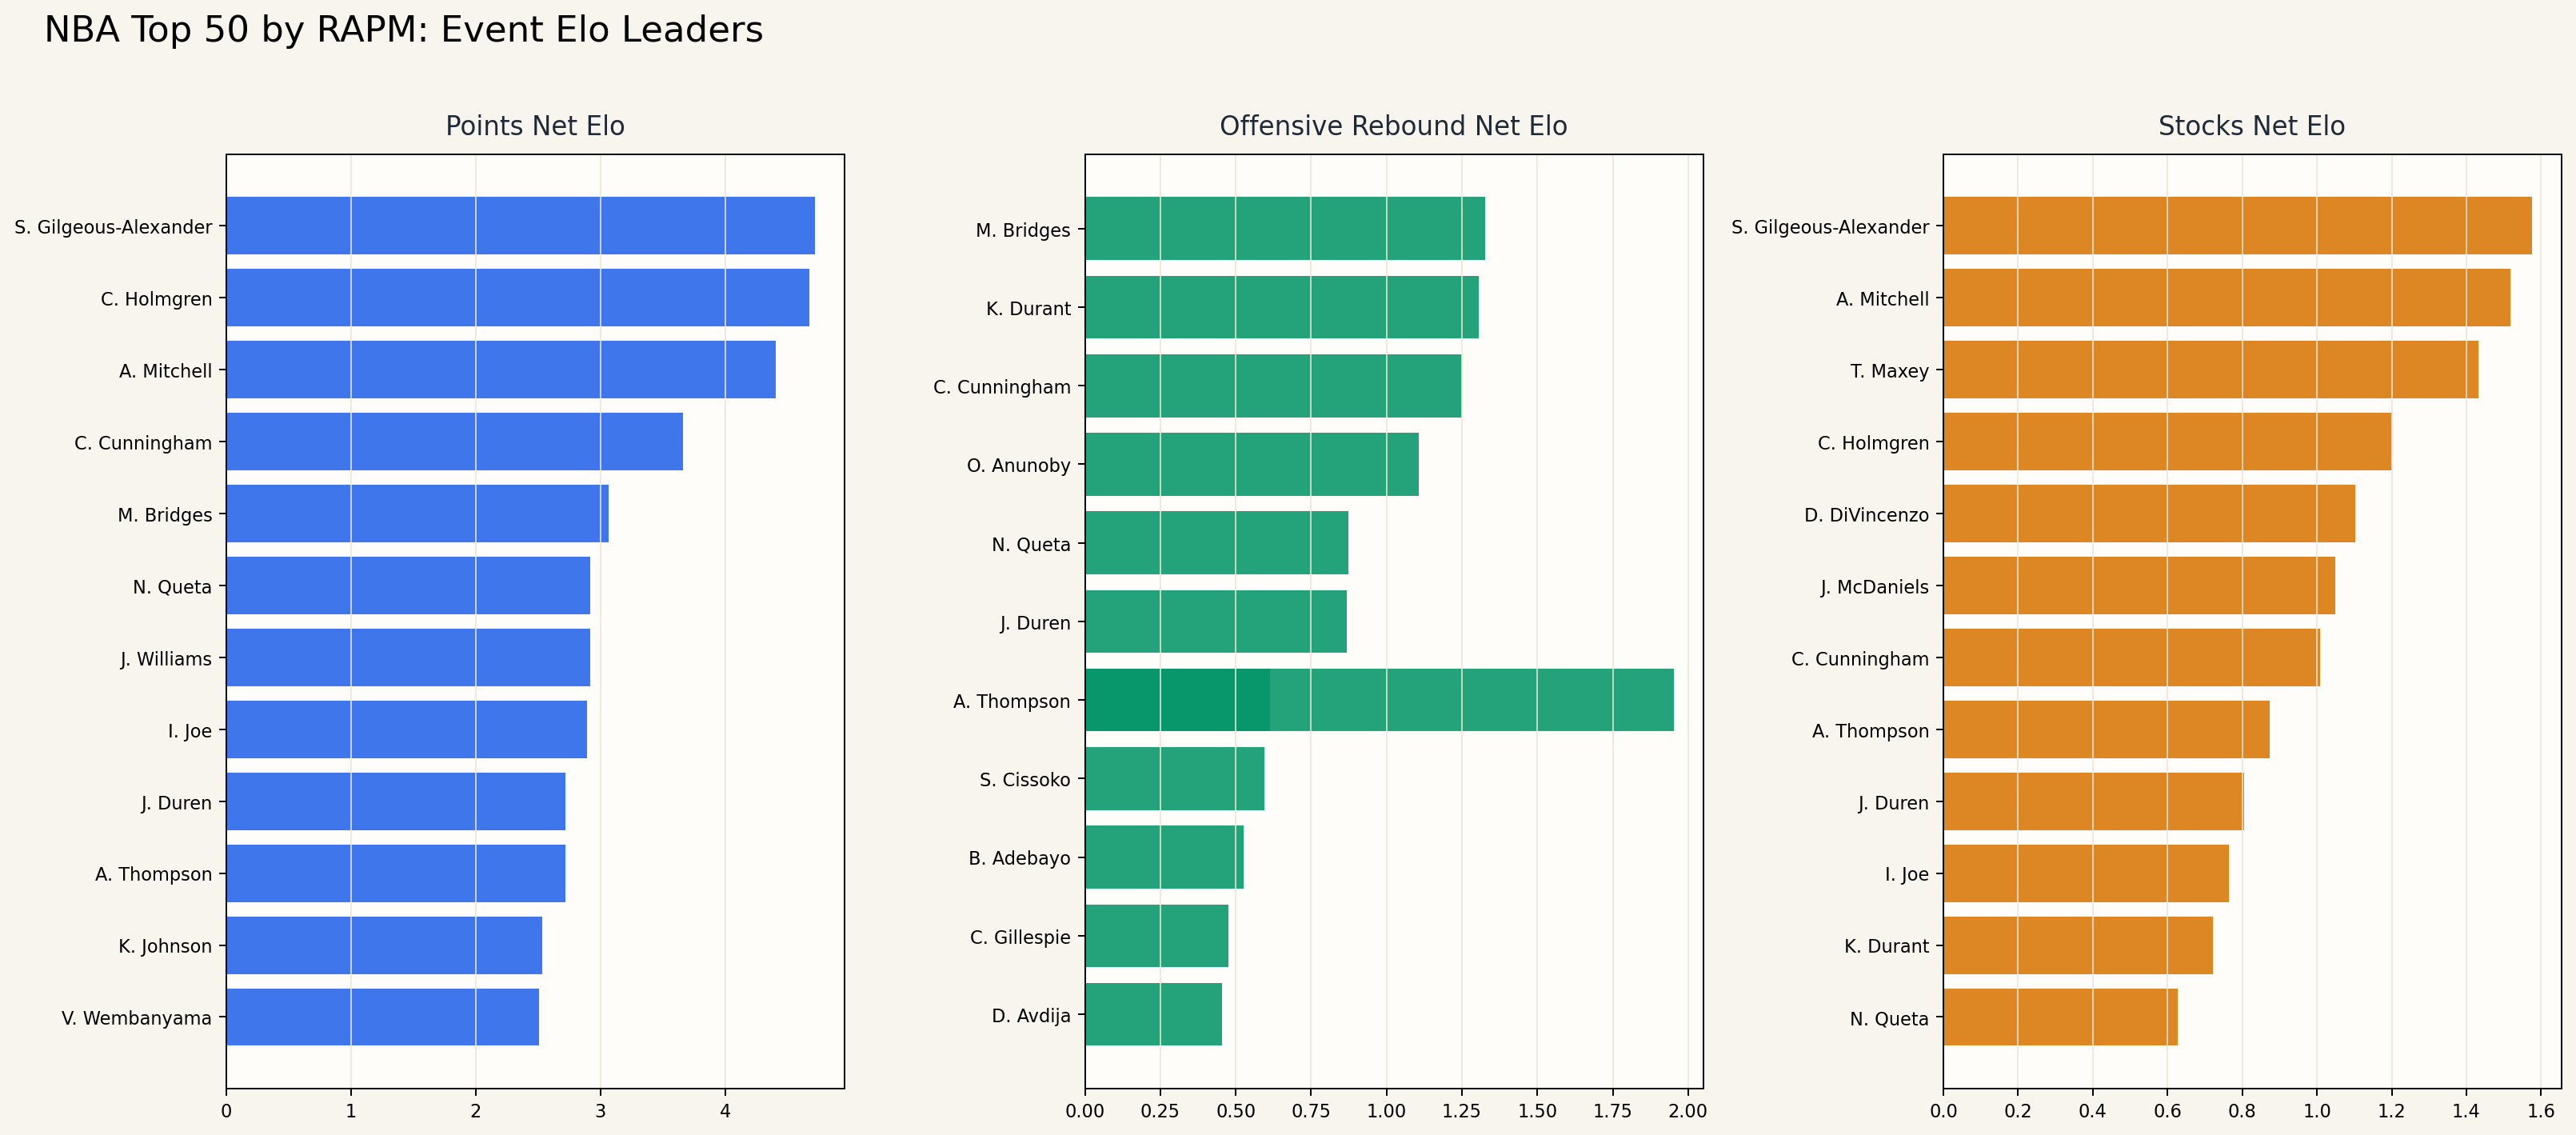
NBA panel: top 50 players by RAPM Overall among players with 1000+ minutes, plotted in the event-Elo points space.
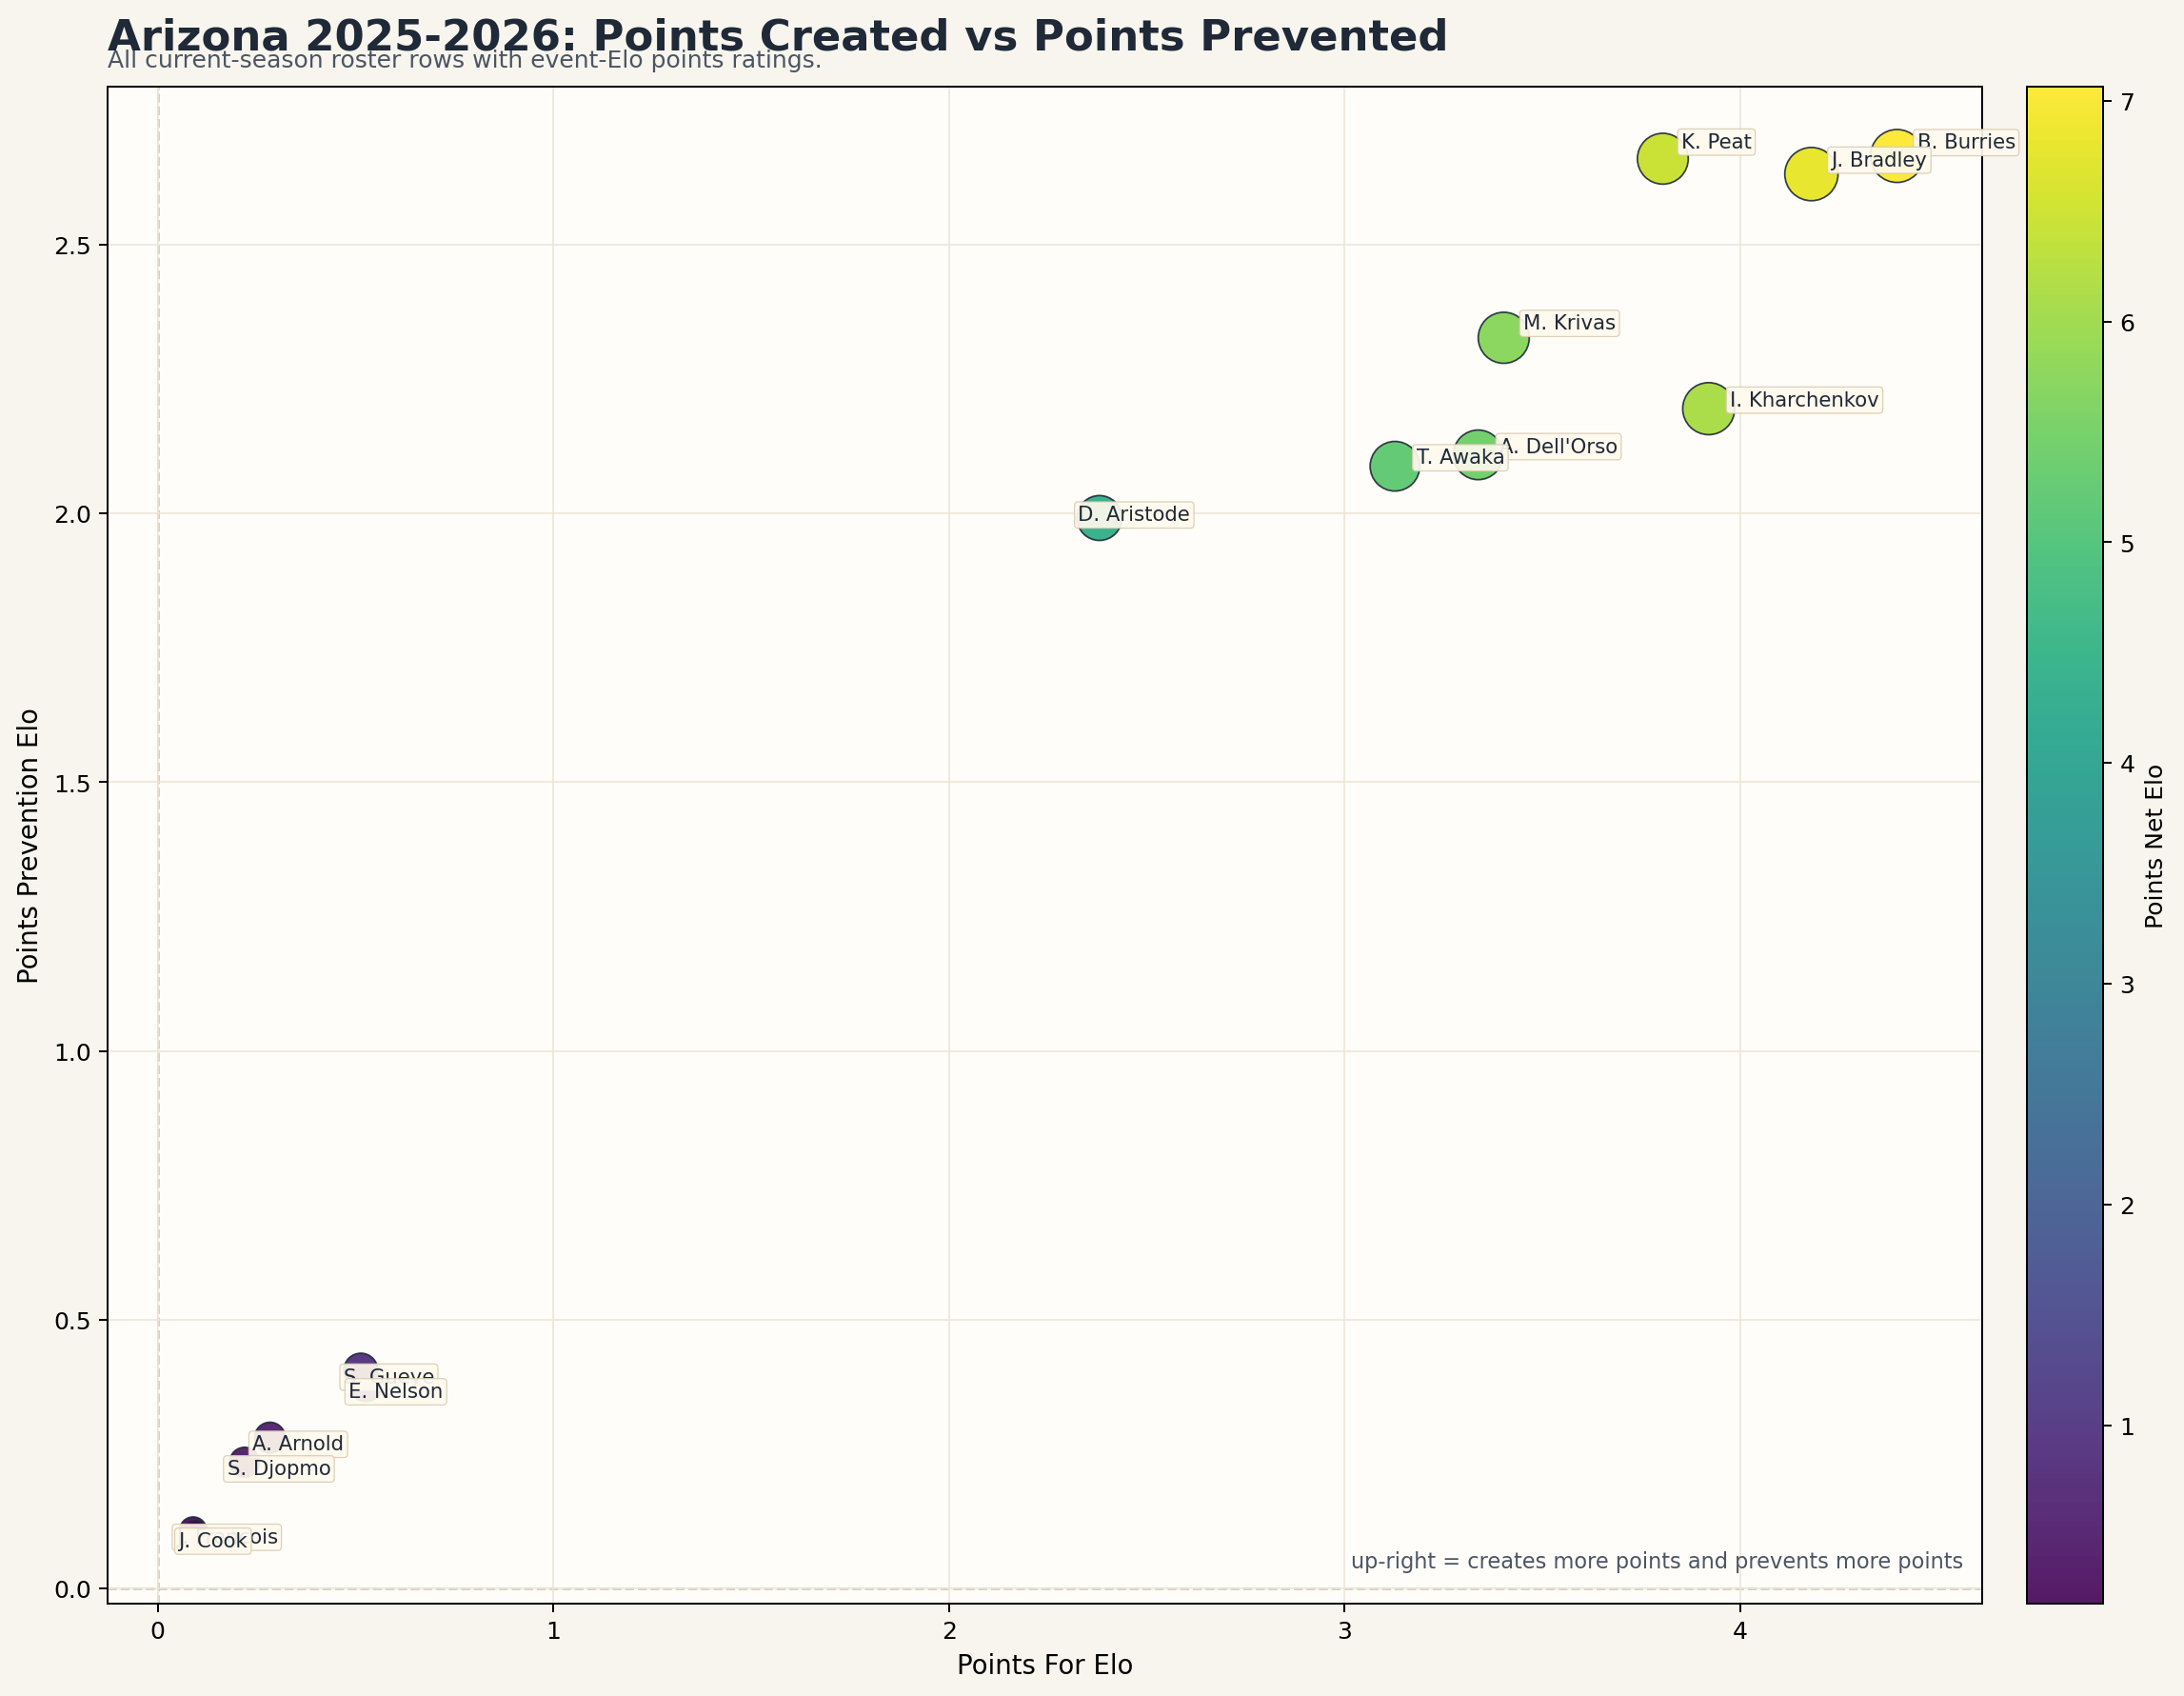
Arizona panel: every Arizona player with a current-season event-Elo row.
What I Learned
- The points split is immediately more interpretable than raw
Vec2. You can read offense and defense directly instead of guessing latent axes. - Arizona looks sensible in this frame:
B. Burries,J. Bradley,K. Peat, andI. Kharchenkovall grade as strong two-way point contributors in the current fit. - The family has real holdout lift on several event types, especially NBA points/rebounds/stocks and NCAAM assists/threes/turnovers.
- The biggest weakness is exactly what the raw leaderboards suggest: the model is still team-context heavy. NBA
Points Net Eloonly correlates modestly withRAPM Overall, so this is not yet an adjusted all-in player value model. - In other words: this is already a useful event microscope, but not yet the final answer to 'best player' in the same sense as RAPM.
Holdout
Strict holdout here means: fit on games before the trailing 7-day window, then predict the final 7 days using the actual played-minute mix in those holdout games.
NBA Holdout
| Event | Model RMSE | Mean RMSE | Lift | Corr | Team Games |
|---|---|---|---|---|---|
| Points | 10.555 | 10.986 | 0.430 | 0.431 | 100 |
| Rebounds | 6.214 | 6.501 | 0.288 | 0.503 | 100 |
| Offensive Rebounds | 3.761 | 3.967 | 0.205 | 0.468 | 100 |
| Defensive Rebounds | 5.152 | 5.331 | 0.179 | 0.466 | 100 |
| Assists | 4.606 | 4.807 | 0.202 | 0.427 | 100 |
| Threes | 3.900 | 4.118 | 0.218 | 0.499 | 100 |
| Stocks | 3.853 | 3.968 | 0.115 | 0.302 | 100 |
| Turnovers | 3.613 | 3.755 | 0.142 | 0.402 | 100 |
NCAAM Holdout
| Event | Model RMSE | Mean RMSE | Lift | Corr | Team Games |
|---|---|---|---|---|---|
| Points | 15.576 | 15.438 | -0.138 | 0.392 | 618 |
| Rebounds | 8.750 | 8.864 | 0.115 | 0.391 | 618 |
| Offensive Rebounds | 6.510 | 5.567 | -0.943 | 0.269 | 618 |
| Defensive Rebounds | 11.502 | 6.583 | -4.919 | 0.133 | 618 |
| Assists | 6.209 | 6.500 | 0.290 | 0.467 | 618 |
| Threes | 4.508 | 4.723 | 0.215 | 0.493 | 618 |
| Stocks | 4.824 | 4.950 | 0.126 | 0.293 | 618 |
| Turnovers | 4.720 | 4.863 | 0.143 | 0.361 | 618 |
Positive Lift means the event model beat a flat holdout mean baseline.
Cross-Model Overlap
| League | Qualified | PtsNet vs RAPM | PtsNet vs PM/100 | RebNet vs RAPM | TONet vs RAPM |
|---|---|---|---|---|---|
| nba | 220 | 0.420 | 0.770 | 0.307 | 0.174 |
| ncaam | 345 | 0.740 | 0.814 | 0.563 | 0.301 |
Read this as overlap, not as a target. Lower correlation with RAPM is not automatically bad; it can also mean the event family is describing something more specific.
NBA Top 50 by RAPM in Points Space
| RAPM Rank | Player | Team | Pts For | Pts Prevent | Pts Net | OReb Net | Stocks Net | RAPM |
|---|---|---|---|---|---|---|---|---|
| 1 | Victor Wembanyama | SAS | 0.898 | 1.610 | 2.509 | -0.150 | 0.129 | 4.474 |
| 2 | Cade Cunningham | DET | 0.812 | 2.851 | 3.663 | 1.249 | 1.008 | 3.999 |
| 3 | Kevin Durant | HOU | 0.658 | 0.794 | 1.451 | 1.306 | 0.721 | 3.681 |
| 4 | Nikola Jokić | DEN | 3.177 | -1.183 | 1.994 | 0.001 | -1.005 | 3.555 |
| 5 | Collin Gillespie | PHX | -0.697 | 0.850 | 0.153 | 0.477 | 0.584 | 3.305 |
| 6 | Jaylin Williams | OKC | 0.934 | 1.983 | 2.917 | -0.757 | 0.424 | 3.026 |
| 7 | Austin Reaves | LAL | 1.254 | -0.224 | 1.030 | -0.646 | 0.000 | 2.968 |
| 8 | Neemias Queta | BOS | 1.282 | 1.638 | 2.920 | 0.874 | 0.628 | 2.898 |
| 9 | Oso Ighodaro | PHX | -0.421 | 0.557 | 0.136 | 0.313 | 0.442 | 2.874 |
| 10 | Jalen Duren | DET | 0.394 | 2.325 | 2.719 | 0.869 | 0.805 | 2.818 |
| 11 | Michael Porter Jr. | BKN | -1.613 | -1.086 | -2.699 | 0.379 | -1.013 | 2.654 |
| 12 | Svi Mykhailiuk | UTA | -0.136 | -1.791 | -1.927 | 0.189 | -0.845 | 2.578 |
| 13 | Jimmy Butler III | GSW | 0.947 | 0.584 | 1.531 | -0.070 | 0.496 | 2.458 |
| 14 | Luka Dončić | LAL | 1.344 | -0.211 | 1.133 | -0.663 | 0.477 | 2.438 |
| 15 | Deni Avdija | POR | -0.655 | -0.803 | -1.458 | 0.453 | -2.037 | 2.411 |
| 16 | Mikal Bridges | NYK | 1.549 | 1.519 | 3.069 | 1.326 | 0.240 | 2.399 |
| 17 | Tyrese Maxey | PHI | 0.223 | 0.691 | 0.914 | 0.009 | 1.433 | 2.381 |
| 18 | Donovan Clingan | POR | -0.204 | -0.061 | -0.265 | 0.208 | -1.472 | 2.367 |
| 19 | Shai Gilgeous-Alexander | OKC | 1.155 | 3.568 | 4.723 | -1.569 | 1.576 | 2.274 |
| 20 | Jose Alvarado | NOP | -0.545 | -0.134 | -0.680 | -0.161 | 0.248 | 2.222 |
| 21 | Bam Adebayo | MIA | -0.095 | 1.335 | 1.241 | 0.526 | -0.057 | 2.182 |
| 22 | Amen Thompson | HOU | 0.319 | 1.507 | 1.826 | 1.952 | 0.297 | 2.176 |
| 23 | Donte DiVincenzo | MIN | 0.648 | 0.796 | 1.444 | -0.008 | 1.102 | 2.146 |
| 24 | Sandro Mamukelashvili | TOR | -0.128 | 0.684 | 0.556 | 0.025 | 0.344 | 2.144 |
| 25 | Dylan Harper | SAS | 1.219 | 1.220 | 2.439 | -0.476 | 0.422 | 2.081 |
| 26 | Wendell Carter Jr. | ORL | -0.890 | 1.024 | 0.133 | 0.101 | 0.220 | 2.068 |
| 27 | Quinten Post | GSW | -0.203 | 0.690 | 0.487 | -0.236 | 0.198 | 2.063 |
| 28 | Jalen Suggs | ORL | -0.123 | 1.125 | 1.002 | 0.060 | 0.210 | 2.063 |
| 29 | Jaime Jaquez Jr. | MIA | 0.184 | 1.415 | 1.599 | 0.015 | -0.018 | 2.050 |
| 30 | Ajay Mitchell | OKC | 1.606 | 2.801 | 4.407 | -0.911 | 1.517 | 2.040 |
| 31 | Dyson Daniels | ATL | 0.291 | 0.654 | 0.945 | -0.536 | 0.139 | 1.944 |
| 32 | Tim Hardaway Jr. | DEN | 2.155 | -1.163 | 0.992 | -0.712 | -0.850 | 1.891 |
| 33 | Noah Clowney | BKN | -1.707 | -1.193 | -2.900 | 0.158 | -0.864 | 1.765 |
| 34 | Keldon Johnson | SAS | 0.951 | 1.582 | 2.533 | 0.095 | 0.388 | 1.726 |
| 35 | Isaiah Joe | OKC | 0.730 | 2.162 | 2.892 | -0.785 | 0.764 | 1.701 |
| 36 | Jamal Murray | DEN | 3.454 | -2.171 | 1.283 | -0.945 | -1.165 | 1.689 |
| 37 | Chet Holmgren | OKC | 1.113 | 3.562 | 4.675 | -0.964 | 1.200 | 1.656 |
| 38 | Evan Mobley | CLE | 0.479 | 0.681 | 1.159 | 0.259 | 0.353 | 1.613 |
| 39 | Tristan da Silva | ORL | -0.124 | 0.725 | 0.601 | 0.058 | -0.010 | 1.609 |
| 40 | Ausar Thompson | DET | 0.460 | 2.257 | 2.718 | 0.612 | 0.873 | 1.580 |
| 41 | OG Anunoby | NYK | 1.162 | 1.243 | 2.406 | 1.107 | 0.138 | 1.578 |
| 42 | Jarrett Allen | CLE | 1.312 | 0.600 | 1.912 | -0.034 | 0.175 | 1.572 |
| 43 | Vít Krejčí | ATL | -0.331 | -0.321 | -0.653 | -0.000 | -0.174 | 1.487 |
| 44 | Norman Powell | MIA | 0.141 | 0.518 | 0.659 | 0.193 | -0.275 | 1.431 |
| 45 | Sidy Cissoko | POR | -0.626 | -0.195 | -0.821 | 0.594 | -1.172 | 1.417 |
| 46 | Rui Hachimura | LAL | 1.233 | -0.473 | 0.759 | -0.588 | 0.052 | 1.407 |
| 47 | Davion Mitchell | MIA | -0.011 | 1.384 | 1.373 | -0.221 | 0.232 | 1.383 |
| 48 | Jaden McDaniels | MIN | 0.805 | 0.645 | 1.450 | -0.037 | 1.048 | 1.341 |
| 49 | Myles Turner | MIL | -0.910 | -0.937 | -1.846 | -1.015 | -0.640 | 1.308 |
| 50 | Pascal Siakam | IND | -1.383 | -1.563 | -2.945 | -0.398 | -0.200 | 1.299 |
Arizona Roster in Points Space
| Team Rank | Player | Pts For | Pts Prevent | Pts Net | OReb Net | DReb Net | Stocks Net | Minutes |
|---|---|---|---|---|---|---|---|---|
| 1 | B. Burries | 4.396 | 2.665 | 7.061 | 1.112 | 3.720 | 1.053 | 887.0 |
| 2 | J. Bradley | 4.179 | 2.632 | 6.811 | 1.058 | 3.795 | 1.072 | 911.0 |
| 3 | K. Peat | 3.804 | 2.660 | 6.464 | 0.818 | 3.747 | 0.944 | 732.0 |
| 4 | I. Kharchenkov | 3.920 | 2.195 | 6.115 | 1.000 | 3.345 | 0.849 | 816.0 |
| 5 | M. Krivas | 3.402 | 2.327 | 5.729 | 0.980 | 3.162 | 0.817 | 746.0 |
| 6 | A. Dell'Orso | 3.337 | 2.109 | 5.447 | 0.920 | 2.761 | 0.776 | 648.0 |
| 7 | T. Awaka | 3.127 | 2.088 | 5.215 | 0.774 | 2.774 | 0.796 | 648.0 |
| 8 | D. Aristode | 2.380 | 1.992 | 4.372 | 0.554 | 2.162 | 0.656 | 391.0 |
| 9 | S. Gueye | 0.514 | 0.406 | 0.919 | 0.142 | 0.357 | 0.151 | 78.000 |
| 10 | E. Nelson | 0.526 | 0.379 | 0.905 | 0.158 | 0.323 | 0.164 | 73.000 |
| 11 | A. Arnold | 0.284 | 0.280 | 0.564 | 0.097 | 0.241 | 0.072 | 38.000 |
| 12 | S. Djopmo | 0.220 | 0.235 | 0.454 | 0.074 | 0.194 | 0.059 | 30.000 |
| 13 | J. Francois | 0.090 | 0.108 | 0.197 | 0.025 | 0.087 | 0.031 | 12.000 |
| 14 | J. Cook | 0.096 | 0.101 | 0.197 | 0.031 | 0.083 | 0.034 | 12.000 |
Path Forward
- Use these event models as the interpretable 2D baseline:
points_forandpoints_againstare the clean intermediate win the earlier Vec2 was missing. - Add projected-minute inputs so holdout predictions stop using realized minute shares.
- Add teammate/opponent adjustment or hierarchical team priors so the raw leaderboards stop inheriting as much team strength.
- Rebuild the nonlinear vector model on top of this decomposition rather than jumping straight to opaque latent axes.
Reproduce
python scripts/generate_player_event_elo_report.py --nba-season 2025-2026 --team-season 2025-2026 --team-name "Arizona"