Bayesian Recruiting Model: Revealed Preferences in College Basketball
Inferring Program Quality from Recruiting Patterns
The 247 Composite gives us recruit rankings, but where recruits get offers and where they commit reveals hidden information about program quality.
We built a Hierarchical Bayesian Model that jointly estimates: 1. Recruit Quality: Partially observed via 247 rating, refined by offer patterns 2. Program Recruiting Power: Revealed by who they can attract offers from and sign
The Key Insight: Offers as Signals
When Duke offers a recruit, it's a signal. When Kentucky and Duke both offer the same recruit, that's a stronger signal about the recruit's quality. And when a 3-star gets offers from multiple blue bloods, maybe the ratings are missing something.
Model Structure
Offer Likelihood (identifies recruit quality): $$P(Offer_{i,p}) = \sigma(\alpha_0 + \alpha_1 r_i)$$
Where $r_i$ = recruit quality (anchored to 247 rating). Better recruits get more offers overall.
Commitment Choice (identifies program quality): $$P(Commit\ to\ p | offers) = softmax(\beta \cdot \phi_p)$$
Among programs that offered, recruits choose based on program quality $\phi_p$. This is the key signal—when a top recruit picks Kentucky over Duke, that reveals Kentucky's recruiting power.
Model Results
Data: Classes 2010-2026
Key Parameters
| Parameter | Estimate | Interpretation |
|---|---|---|
| γ (247 trust) | 0.286 ± 0.254 | How much we trust 247 ratings |
| α₁ (recruit → offer) | -0.078 | Better recruits get more offers |
| β (choice sensitivity) | 0.882 ± 0.464 | How much commits favor top programs |
Interpretation of γ = 0.29: The model partially adjusts 247 ratings, but offer patterns provide additional signal.
Top 30 Programs by Recruiting Power
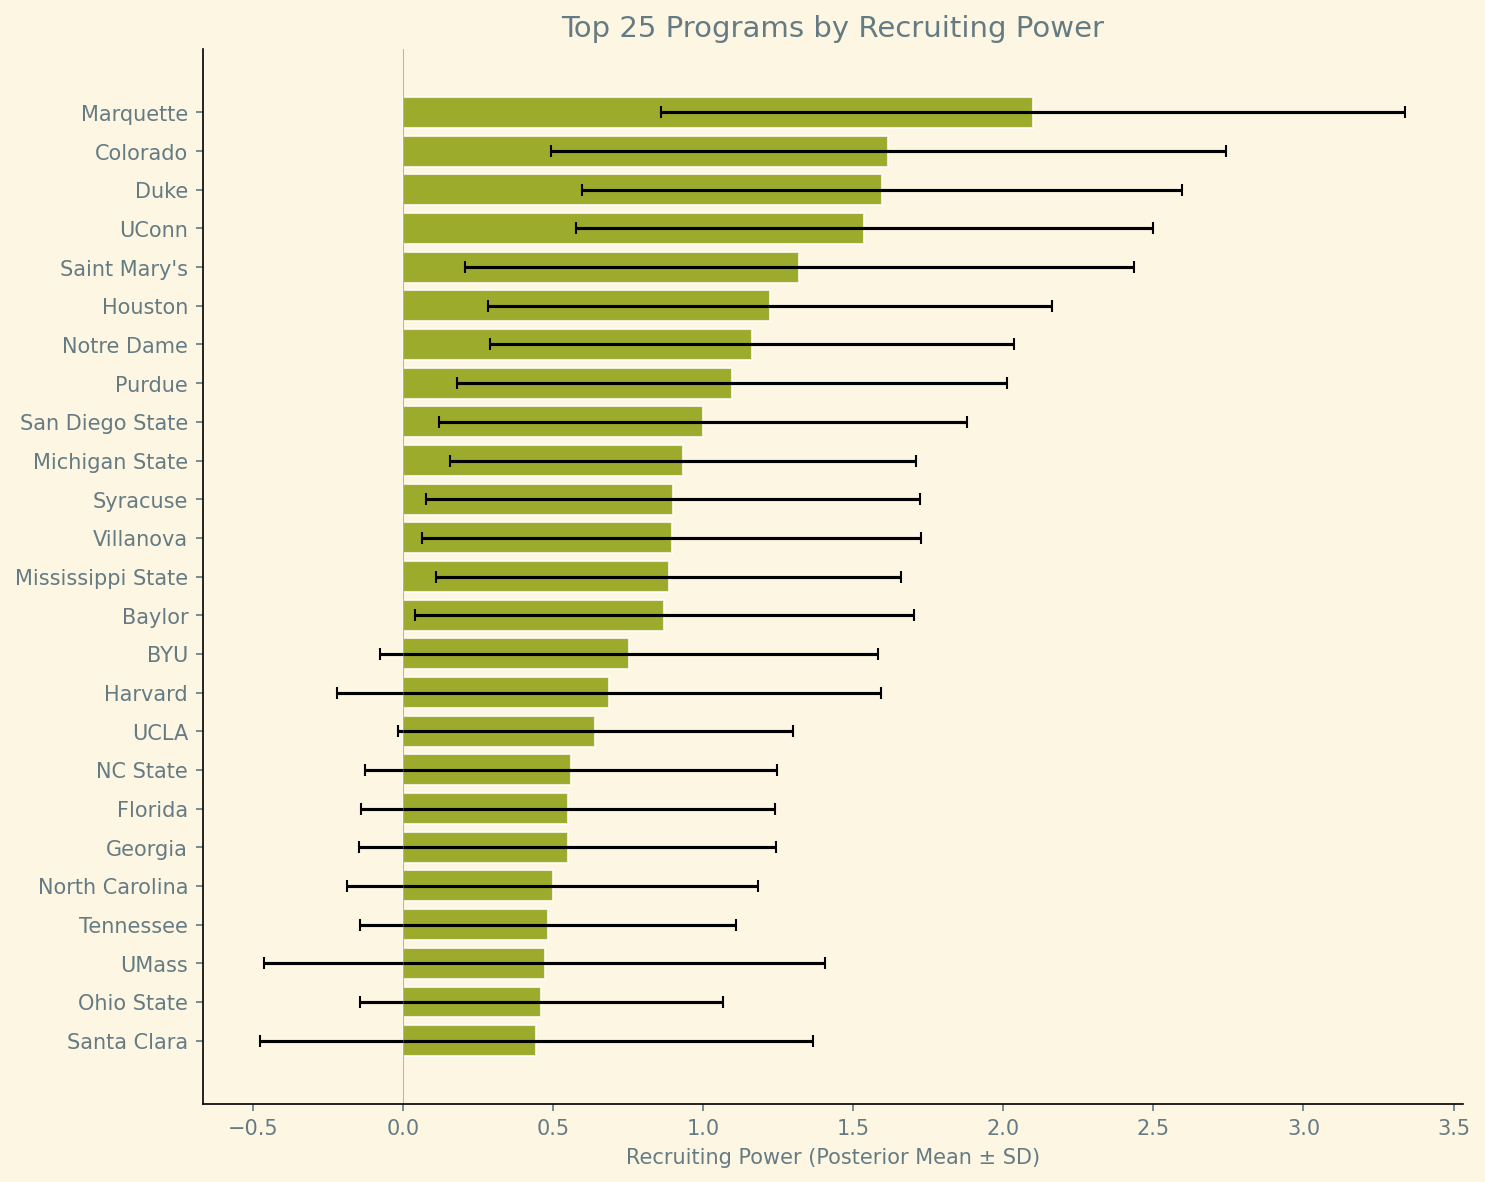
These programs have the highest revealed recruiting power—they get offers accepted and land commits from top recruits.
| Rank | Program | Rating | Uncertainty (SD) |
|---|---|---|---|
| 1 | Marquette | +2.099 | ±1.241 |
| 2 | Colorado | +1.617 | ±1.125 |
| 3 | Duke | +1.596 | ±0.999 |
| 4 | UConn | +1.537 | ±0.961 |
| 5 | Saint Mary's | +1.320 | ±1.115 |
| 6 | Houston | +1.222 | ±0.939 |
| 7 | Notre Dame | +1.162 | ±0.874 |
| 8 | Purdue | +1.095 | ±0.916 |
| 9 | San Diego State | +0.998 | ±0.880 |
| 10 | Michigan State | +0.933 | ±0.775 |
| 11 | Syracuse | +0.898 | ±0.824 |
| 12 | Villanova | +0.895 | ±0.832 |
| 13 | Mississippi State | +0.885 | ±0.775 |
| 14 | Baylor | +0.869 | ±0.832 |
| 15 | BYU | +0.751 | ±0.829 |
| 16 | Harvard | +0.685 | ±0.907 |
| 17 | UCLA | +0.640 | ±0.658 |
| 18 | NC State | +0.559 | ±0.687 |
| 19 | Florida | +0.549 | ±0.689 |
| 20 | Georgia | +0.548 | ±0.695 |
| 21 | North Carolina | +0.498 | ±0.685 |
| 22 | Tennessee | +0.482 | ±0.627 |
| 23 | UMass | +0.472 | ±0.935 |
| 24 | Ohio State | +0.460 | ±0.604 |
| 25 | Santa Clara | +0.443 | ±0.921 |
| 26 | Cincinnati | +0.414 | ±0.688 |
| 27 | Auburn | +0.381 | ±0.622 |
| 28 | Georgia State | +0.363 | ±0.983 |
| 29 | Iowa State | +0.360 | ±0.756 |
| 30 | Rutgers | +0.348 | ±0.723 |
What the Model Reveals
1. Rating Validation
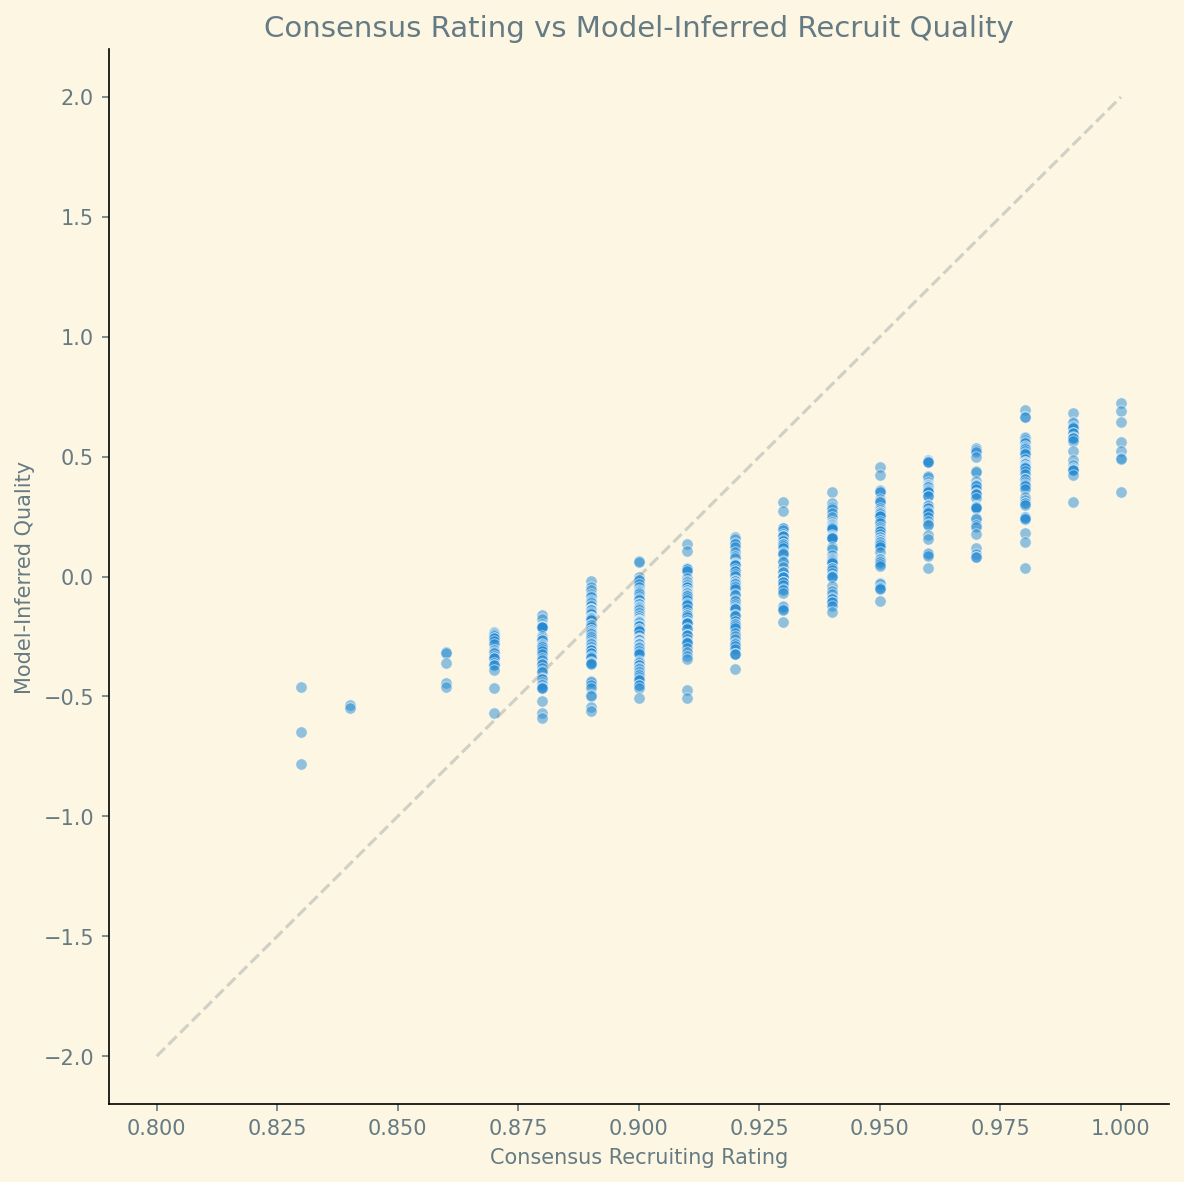
The correlation between 247 ratings and model-inferred quality validates that recruiting services capture real signal. But the scatter shows the model finds additional information in offer patterns.
2. Recruits Outperforming Their Rankings
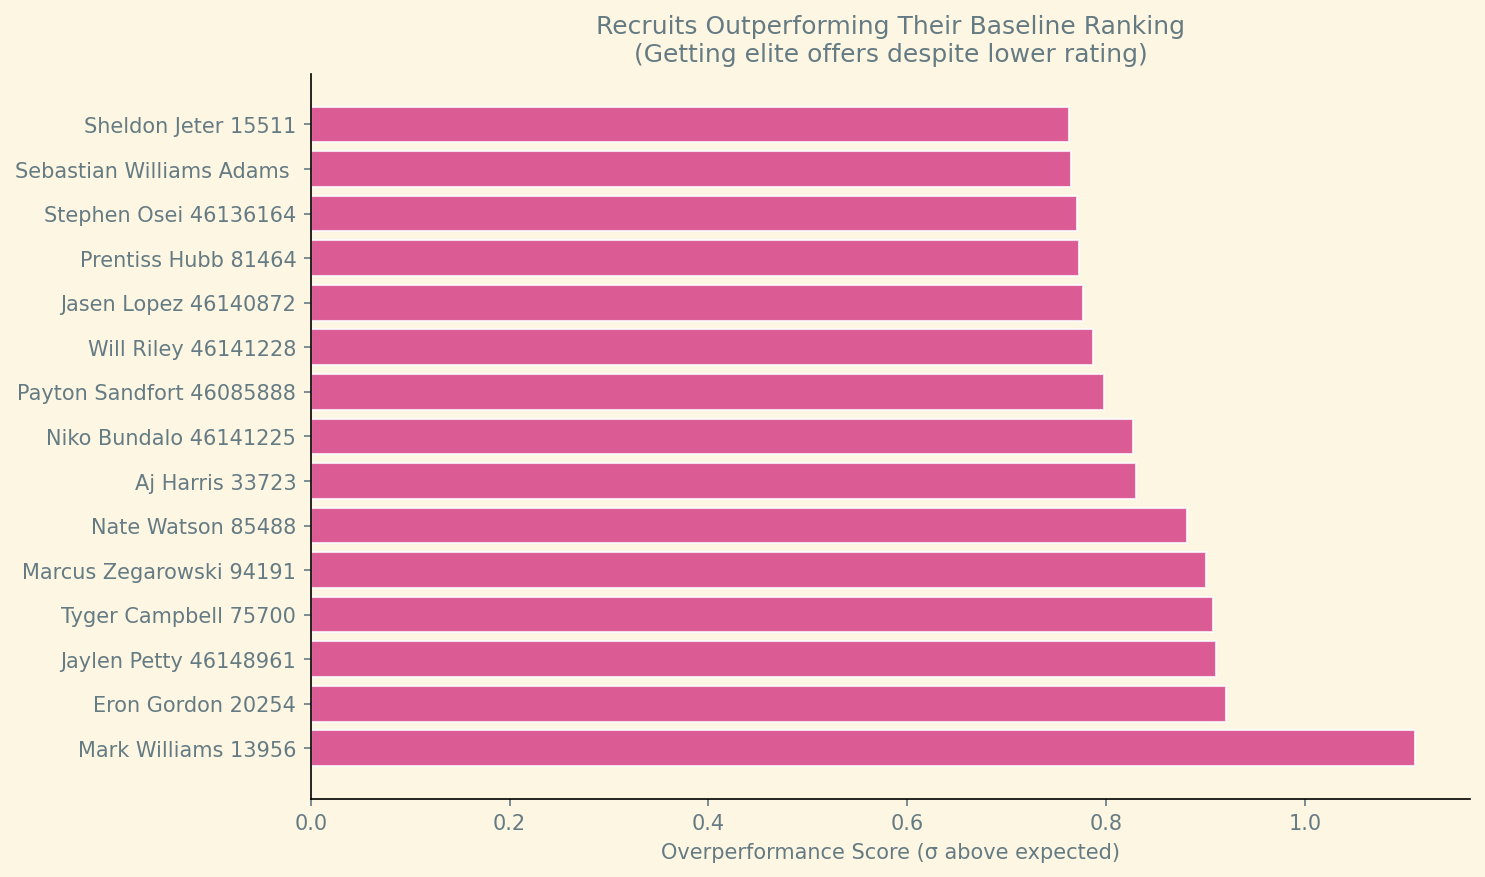
These recruits are getting better offers than their 247 ranking would suggest. This could indicate: - Late bloomers the model is catching - Strong AAU/camp performances not yet reflected in rankings - Programs with better scouting finding hidden gems
Bottom 15 Programs (in our sample)
| Rank | Program | Rating | Uncertainty (SD) |
|---|---|---|---|
| 137 | Minnesota | -0.662 | ±0.754 |
| 138 | Arizona State | -0.679 | ±0.740 |
| 139 | Kentucky | -0.723 | ±0.806 |
| 140 | California | -0.734 | ±0.774 |
| 141 | Tulsa | -0.754 | ±0.970 |
| 142 | Kansas State | -0.770 | ±0.863 |
| 143 | South Florida | -0.804 | ±0.950 |
| 144 | USC | -0.808 | ±0.793 |
| 145 | Miami | -0.831 | ±0.772 |
| 146 | Georgia Tech | -0.861 | ±0.790 |
| 147 | Nebraska | -0.903 | ±0.860 |
| 148 | East Carolina | -1.069 | ±1.004 |
| 149 | Texas Tech | -1.084 | ±1.004 |
| 150 | Vanderbilt | -1.087 | ±0.955 |
| 151 | Virginia Tech | -1.425 | ±0.996 |
Methodology Notes
This model uses: - PyMC for Bayesian inference with NUTS sampling - Non-centered parameterization for efficient sampling - Bernoulli likelihood for offers (positive + negative samples) - Categorical likelihood for commitment choices (multinomial logit)
Key identification: 1. Offer patterns: Which programs offer which recruits 2. Choice data: Among offers, where recruits commit 3. 247 ratings as informative priors on recruit quality