Bayesian Coach Model: Separating Skill from Brand
A Hierarchical Bayesian Approach to Coaching
The fundamental question in college basketball: Is Coach X good, or just at a good school?
We built a Hierarchical Bayesian Model that jointly estimates: 1. Program Quality: The inherent strength of a program (recruiting base, facilities, tradition) 2. Coach Skill: The portable skill a coach brings (Xs and Os, player development)
The Key Innovation: Modeling Selection
Most models treat "Coach X is at Program Y" as exogenous. But it's not—good coaches get hired by good programs. We explicitly model this assortative matching:
$$P(\text{Coach C at Program P}) \propto \exp(\rho \cdot \text{CoachSkill}_C \cdot \text{ProgramQuality}_P)$$
Where $\rho$ measures the strength of assortative matching.
Model Results
Data: NCAAM games from 2014-present
Key Parameters
| Parameter | Estimate | Std Dev | Interpretation |
|---|---|---|---|
| Home Advantage | 0.435 | 0.009 | Log-odds boost for home team |
| Selection Correlation (ρ) | 0.518 | 0.224 | How strongly good coaches match to good programs |
| σ_program | 1.032 | - | Spread of program quality |
| σ_coach | 0.535 | - | Spread of coach skill |
Interpretation of ρ = 0.52: Strong assortative matching—good coaches do tend to be at good programs.
Variance Decomposition
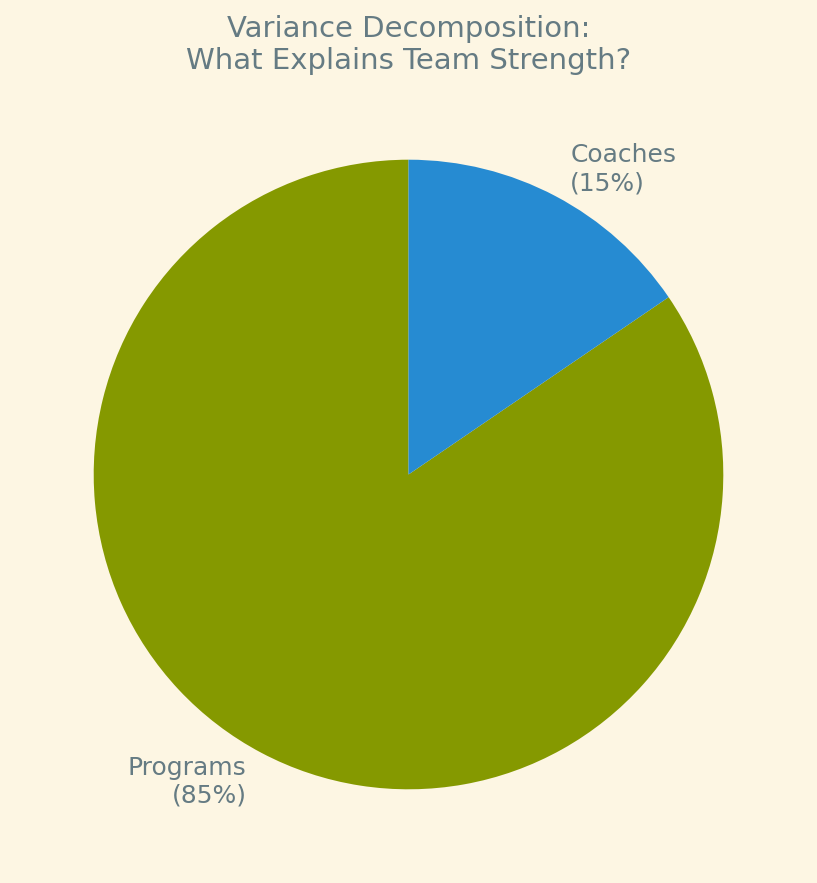
Programs explain the majority of team strength variation. This doesn't mean coaches don't matter—it means the baseline of where you coach matters a lot.
Top 30 Coaches (by Posterior Mean Skill)
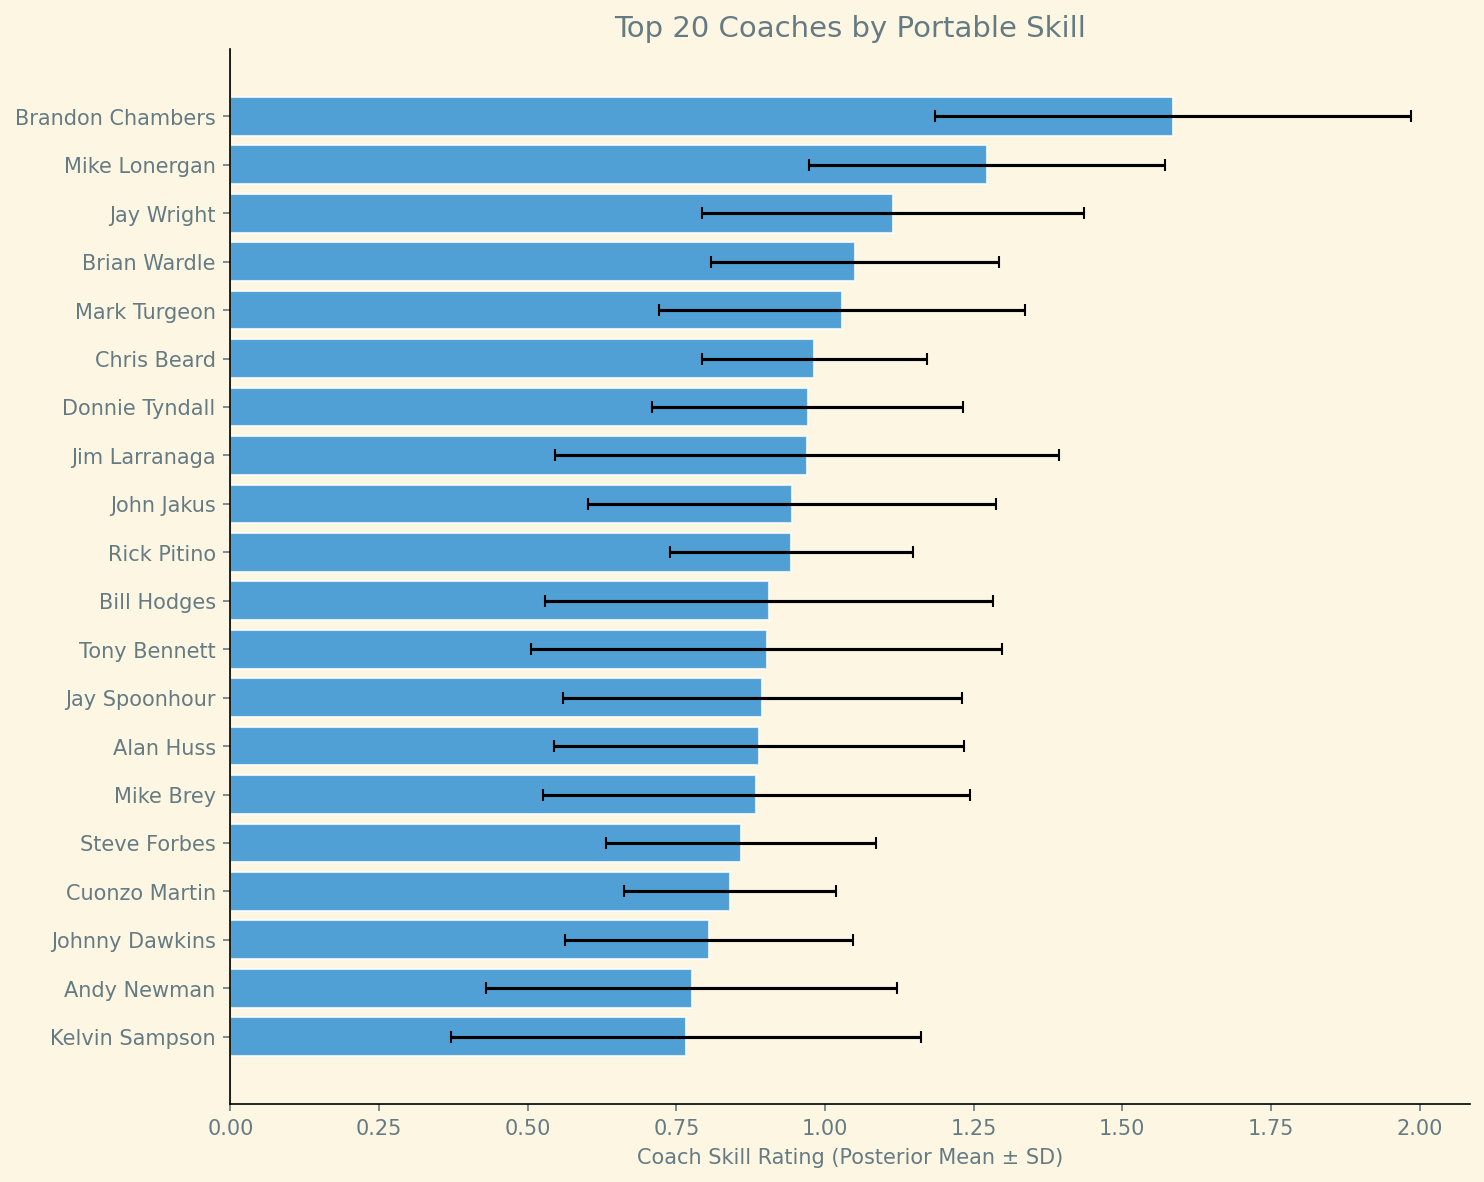
These coaches have skill that the model identifies as portable—it would follow them to a new job.
| Rank | Coach | Rating | Uncertainty (SD) |
|---|---|---|---|
| 1 | Brandon Chambers | +1.585 | ±0.400 |
| 2 | Mike Lonergan | +1.272 | ±0.299 |
| 3 | Jay Wright | +1.114 | ±0.321 |
| 4 | Brian Wardle | +1.051 | ±0.242 |
| 5 | Mark Turgeon | +1.028 | ±0.308 |
| 6 | Chris Beard | +0.982 | ±0.189 |
| 7 | Donnie Tyndall | +0.971 | ±0.262 |
| 8 | Jim Larranaga | +0.970 | ±0.424 |
| 9 | John Jakus | +0.945 | ±0.343 |
| 10 | Rick Pitino | +0.943 | ±0.204 |
| 11 | Bill Hodges | +0.906 | ±0.377 |
| 12 | Tony Bennett | +0.902 | ±0.396 |
| 13 | Jay Spoonhour | +0.895 | ±0.336 |
| 14 | Alan Huss | +0.889 | ±0.345 |
| 15 | Mike Brey | +0.885 | ±0.359 |
| 16 | Steve Forbes | +0.859 | ±0.227 |
| 17 | Cuonzo Martin | +0.840 | ±0.178 |
| 18 | Johnny Dawkins | +0.805 | ±0.242 |
| 19 | Andy Newman | +0.776 | ±0.346 |
| 20 | Kelvin Sampson | +0.766 | ±0.395 |
| 21 | Shaka Smart | +0.765 | ±0.175 |
| 22 | Jamie Dixon | +0.761 | ±0.238 |
| 23 | Juwan Howard | +0.759 | ±0.316 |
| 24 | Frank Haith | +0.758 | ±0.244 |
| 25 | Nate Oats | +0.750 | ±0.214 |
| 26 | Mike Montgomery | +0.749 | ±0.331 |
| 27 | Antoine Pettway | +0.743 | ±0.385 |
| 28 | James Whitford | +0.739 | ±0.319 |
| 29 | Oliver Purnell | +0.737 | ±0.320 |
| 30 | Jason Gardner | +0.722 | ±0.313 |
Top 25 Programs (by Posterior Mean Quality)
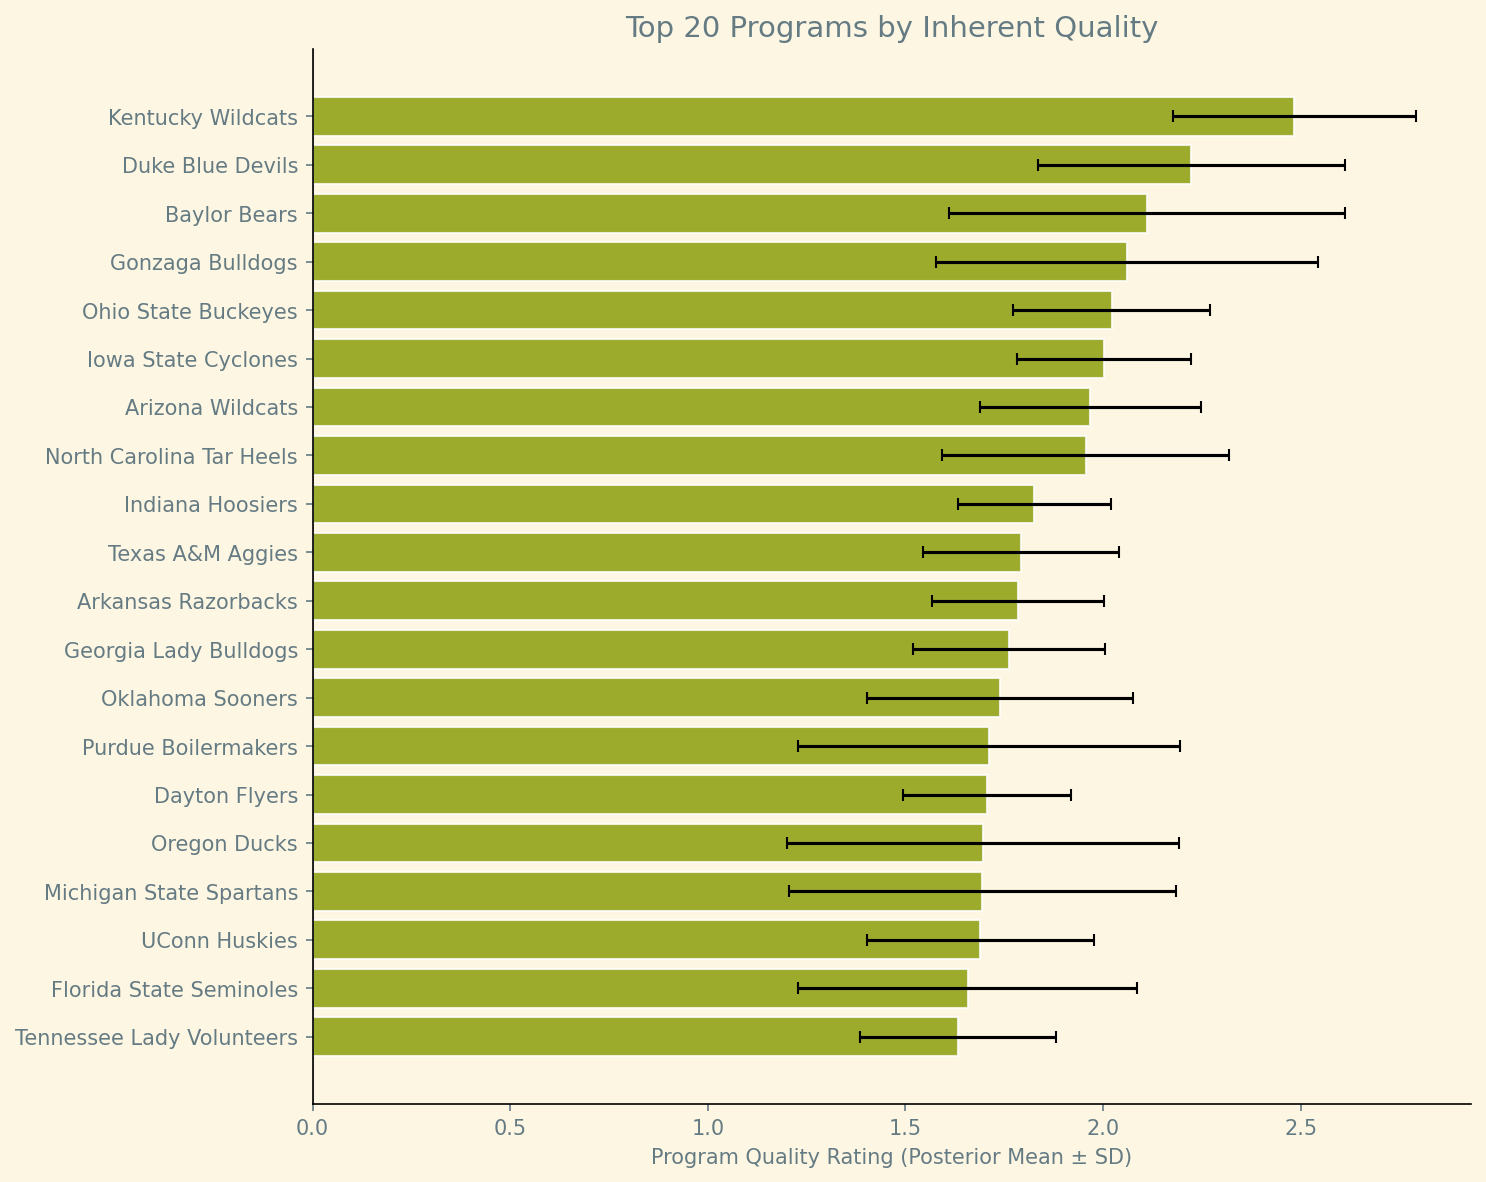
These programs have inherent quality that persists across coaching changes.
| Rank | Program | Rating | Uncertainty (SD) |
|---|---|---|---|
| 1 | Kentucky Wildcats | +2.484 | ±0.308 |
| 2 | Duke Blue Devils | +2.223 | ±0.388 |
| 3 | Baylor Bears | +2.112 | ±0.500 |
| 4 | Gonzaga Bulldogs | +2.061 | ±0.483 |
| 5 | Ohio State Buckeyes | +2.022 | ±0.249 |
| 6 | Iowa State Cyclones | +2.002 | ±0.220 |
| 7 | Arizona Wildcats | +1.967 | ±0.280 |
| 8 | North Carolina Tar Heels | +1.956 | ±0.363 |
| 9 | Indiana Hoosiers | +1.826 | ±0.193 |
| 10 | Texas A&M Aggies | +1.793 | ±0.247 |
| 11 | Arkansas Razorbacks | +1.785 | ±0.217 |
| 12 | Georgia Lady Bulldogs | +1.762 | ±0.242 |
| 13 | Oklahoma Sooners | +1.739 | ±0.336 |
| 14 | Purdue Boilermakers | +1.711 | ±0.483 |
| 15 | Dayton Flyers | +1.707 | ±0.213 |
| 16 | Oregon Ducks | +1.697 | ±0.496 |
| 17 | Michigan State Spartans | +1.694 | ±0.490 |
| 18 | UConn Huskies | +1.689 | ±0.288 |
| 19 | Florida State Seminoles | +1.658 | ±0.428 |
| 20 | Tennessee Lady Volunteers | +1.632 | ±0.248 |
| 21 | Kansas Jayhawks | +1.617 | ±0.480 |
| 22 | BYU Cougars | +1.590 | ±0.272 |
| 23 | South Carolina Gamecocks | +1.556 | ±0.284 |
| 24 | Villanova Wildcats | +1.547 | ±0.314 |
| 25 | Florida Gators | +1.545 | ±0.219 |
The "Brand vs. Man" Question
Consider rho = 0.52: - A positive ρ means we observe selection bias: good coaches at good programs - The model accounts for this when estimating coach skill - Coaches who rank high despite this penalty have truly portable skill
Variance Decomposition
- Program variance (σ²): 1.065
- Coach variance (σ²): 0.286
- Ratio: Programs explain ~79% of team strength variation
Bottom 15 Coaches
| Rank | Coach | Rating | Uncertainty (SD) |
|---|---|---|---|
| 695 | Lance Irvin | -0.871 | ±0.410 |
| 696 | Gerry McNamara | -0.895 | ±0.346 |
| 697 | Rashon Burno | -0.914 | ±0.344 |
| 698 | Andrew Wilson | -0.929 | ±0.389 |
| 699 | Tom Devitt | -0.935 | ±0.448 |
| 700 | Grant Billmeier | -0.938 | ±0.397 |
| 701 | Dan Majerle | -0.948 | ±0.291 |
| 702 | Ray Giacoletti | -0.968 | ±0.277 |
| 703 | Aki Thomas | -1.043 | ±0.288 |
| 704 | Leonard Perry | -1.061 | ±0.331 |
| 705 | Michael Curry | -1.110 | ±0.304 |
| 706 | Kenny Payne | -1.235 | ±0.343 |
| 707 | Joseph Price | -1.272 | ±0.375 |
| 708 | Matt Crenshaw | -1.447 | ±0.409 |
| 709 | George Halcovage III | -1.589 | ±0.351 |
Methodology Notes
This model uses: - PyMC for Bayesian inference with NUTS sampling - Crossed random effects for programs and coaches (not nested) - Assortative matching potential to model the selection process - Bernoulli likelihood for game outcomes (win/loss)
The key identification comes from: 1. Coaches who have worked at multiple programs 2. Programs that have had multiple coaches 3. The prior structure that regularizes both effects