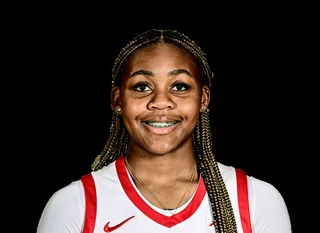
MG Talle
Team: Dayton
Position: F
Career Averages
ESPN · NCAAW · completed source game rows, all recorded phases (including special games). Coverage reflects stored source games. Source phase breakdown: 25 regular season. These are not regular-season totals.
| GP | MPG | PPG | RPG | APG | SPG | BPG | TO | FGA | Nums/G | FG% | 3P% | FT% |
|---|---|---|---|---|---|---|---|---|---|---|---|---|
| 25 | 11.5 | 3.5 | 2.9 | 0.3 | 0.4 | 0.1 | 1.3 | 3.0 | 2.9 | 41.9% | 9.1% | 60.0% |
Plus/minus sample — 2026-2027: 2 games, 38.0 minutes, 132.6 possessions. Model plus/minus and minutes cover qualified stints; a counted game can contain only part of a player's game. A model's games can differ from Season Averages: a run can include playoff games, or only the games with play-by-play.
Advanced Stats
Model outputs use a separate game sample from the counting statistics. Model output season: 2026-2027. Plus/minus scope: 2 games.
| RAPM | Rank | Model PM | Model PM/G | Model PM/40 |
|---|---|---|---|---|
| -3.84 | 4172 | -20 | -10.0 | -21.0 |
RAPM sample — 2026-2027: 37.8 minutes, 125.3 possessions.
RAPM = Regularized Adjusted Plus-Minus, points per 40 minutes above average (a per-100-possession fit scaled by 0.70). Legacy-run units are unverified.
Stat models — 2026-2027
Leaderboards and Box vs LineupEach family in both forms, side by side: the rating, then its percentile among the season's players with that form (the bar). Lineup RAPM: on-court possessions from play-by-play, one regularized regression over the season. Box Elo: game totals spread by minutes; cannot separate teammates; for seasons without play-by-play. Each is an on-floor team-rate impact, not the player's own count. Box Elo is not published for 2026-2027.
| Family | Lineup RAPM | %ile | Box Elo | %ile |
|---|---|---|---|---|
| Points | -3.8 | 4 | not published | |
| Threes | -0.4 | 5 | not published | |
| Assists | not published | not published | ||
| OReb | not published | not published | ||
| DReb | not published | not published | ||
| Stocks | not published | not published | ||
| Turnovers | 0.1 | 49 | not published | |
Points' Lineup RAPM is RAPM itself. Held-out scores, a Box vs Lineup scatter and each form's team share: stat models.
Model Outputs — 2026-2027
CatalogOutput is shown as model rating with league rank in parentheses when available.
| Model | Output | Notes |
|---|---|---|
| Adjusted Plus/Minus Adjusted Plus/Minus Unregularized adjusted plus-minus per 40 minutes. More → | -37.20 (#4204) | - |
| RAPM Overall RAPM Overall Single-parameter regularized adjusted plus-minus estimate. More → | -3.84 (#4172) | SE 4.52 | Poss 125 |
| RAPM Off/Def RAPM Off/Def Simultaneous offensive and defensive RAPM decomposition. More → | -3.44 (#4183) | Off -1.64 | Def -1.80 |
| Plus/Minus Rate Plus/Minus Rate Raw plus/minus rate baseline per 100 possessions. More → | -15.08 (#3679) | PM/G -10.0 | PM/40 -21.0 |
| Threes Lineup RAPM Threes Lineup RAPM Ridge-regularized lineup regression of made threes per 100 possessions. More → | -0.36 (#4113) | - |
| Turnovers Lineup RAPM Turnovers Lineup RAPM Ridge-regularized lineup regression of turnovers (opponent minus own) per 100 possessions. More → | +0.08 (#2215) | - |
League scatter
Shot Chart — 2026-2027
6/13 FG (46.2%), 12 points from the field in 3 games · ESPN shot locations · compared with the 2025-2026 league average (latest season on file)
| Zone | FGM | FGA | FG% | League FG% | +/- | % of FGA |
|---|---|---|---|---|---|---|
| Restricted area | 5 | 6 | 83.3 | 58.6 | +24.7 | 46.2 |
| Paint (non-RA) | 0 | 3 | 0.0 | 40.9 | -40.9 | 23.1 |
| Mid-range left | 0 | 1 | 0.0 | 32.4 | -32.4 | 7.7 |
| Mid-range center | 0 | 0 | - | 35.8 | - | 0.0 |
| Mid-range right | 1 | 1 | 100.0 | 31.8 | +68.2 | 7.7 |
| Left corner 3 | 0 | 0 | - | 33.0 | - | 0.0 |
| Right corner 3 | 0 | 1 | 0.0 | 32.6 | -32.6 | 7.7 |
| Above-break 3 left | 0 | 0 | - | 30.7 | - | 0.0 |
| Above-break 3 center | 0 | 0 | - | 30.4 | - | 0.0 |
| Above-break 3 right | 0 | 1 | 0.0 | 30.9 | -30.9 | 7.7 |
Career Stats
ESPN · NCAAW · completed source game rows, all recorded phases (including special games). Coverage reflects stored source games. Source phase breakdown: 25 regular season. These are not regular-season totals. Other career leagues are available through the league links above.
| Season | League | Team | GP | MIN | PTS | REB | AST | STL | BLK | TO | FGA | Nums/G | FG% | 3P% | FT% | TS% | eFG% |
|---|---|---|---|---|---|---|---|---|---|---|---|---|---|---|---|---|---|
| 2026-2027 | NCAAW | Dayton | 3 | 20.7 | 5.7 | 5.7 | 0.3 | 0.0 | 0.0 | 1.0 | 4.3 | 6.3 | 46.2% | 0.0% | 71.4% | 52.9 | 46.2 |
| 2025-2026 | NCAAW | Dayton | 22 | 10.2 | 3.2 | 2.5 | 0.3 | 0.5 | 0.1 | 1.4 | 2.8 | 2.5 | 41.0% | 11.1% | 57.6% | 46.3 | 41.8 |
Advanced: Nums/G = PTS+REB+AST+STL+BLK-TO-FGA per game, TS% = True Shooting, eFG% = Effective FG
RAPM GS requires a reviewed game-score run and a qualified player and game match. A dash means the score is unavailable.
Game Log — 2026-2027
ESPN · NCAAW · completed source game rows, all recorded phases (including special games). Coverage reflects stored source games. Source phase breakdown: 25 regular season. These are not regular-season totals.
The latest season's 3 of 25 career games; each season's games are under its link above.
| Date | Vs/At | Opponent | Result | Score | MIN | FG | 3PT | FT | REB | AST | STL | BLK | TO | PTS | Nums | RAPM GS |
|---|---|---|---|---|---|---|---|---|---|---|---|---|---|---|---|---|
| 2026-11-15 | vs | Western Michigan Broncos | L | 52-54 | 24 | 2-6 | 0-1 | 2-2 | 9 | 0 | 0 | 0 | 1 | 6 | 8.0 | - |
| 2026-11-09 | vs | Penn State Lady Lions | W | 77-71 | 26 | 3-5 | 0-1 | 3-4 | 6 | 0 | 0 | 0 | 1 | 9 | 9.0 | -23.9 |
| 2026-11-05 | vs | Illinois State Redbirds | L | 87-91 | 12 | 1-2 | 0-0 | 0-1 | 2 | 1 | 0 | 0 | 1 | 2 | 2.0 | -6.4 |