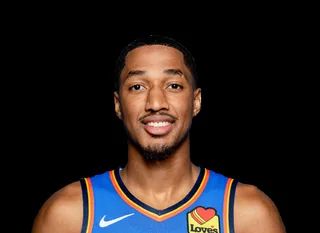
Aaron Wiggins
Team: Atlanta Hawks
Position: G
Career Stats Across Linked Profiles
Season observations across linked profiles for A. Wiggins. Per-game averages from the source shown; select a season to view its profile.
ESPN season totals include all teams and completed recorded phases, including special games; these are not regular-season totals. Team splits are shown on the linked profile.
| Season | League | Team | Source | GP | MIN | PTS | REB | AST |
|---|---|---|---|---|---|---|---|---|
| 2026-2027 | NBA | Atlanta Hawks | NBA Stats | 4 | 27.1 | 15.8 | 3.2 | 1.5 |
| 2025-2026 | NBA | Oklahoma City Thunder | NBA Stats | - | - | - | - | - |
| 2024-2025 | NBA | Oklahoma City Thunder | NBA Stats | - | - | - | - | - |
| 2023-2024 | NBA | Oklahoma City Thunder | NBA Stats | - | - | - | - | - |
| 2022-2023 | NBA | Oklahoma City Thunder | NBA Stats | - | - | - | - | - |
| 2022-2023 | GLEAGUE | Oklahoma City Blue | NBA Stats | 1 | 31.4 | 14.0 | 6.0 | 7.0 |
| 2021-2022 | NBA | Oklahoma City Thunder | NBA Stats | - | - | - | - | - |
| 2020-2021 | NCAAM | Maryland / Nebraska | ESPN | 31 | 33.0 | 14.5 | 5.8 | 2.5 |
| 2019-2020 | NCAAM | Maryland | ESPN | 27 | 28.0 | 10.2 | 4.5 | 1.4 |
| 2018-2019 | NCAAM | Maryland | ESPN | 34 | 22.8 | 8.3 | 3.3 | 0.8 |
Career Averages
STATSNBA · NBA · regular-season appearances. Coverage reflects stored source games. Participation unresolved for 67 of 410 source rows; GP and per-game averages are unknown. Unresolved zero/NULL lines are not classified as DNP.
| GP | MPG | PPG | RPG | APG | SPG | BPG | TO | FGA | Numbers | FG% | 3P% | FT% |
|---|---|---|---|---|---|---|---|---|---|---|---|---|
| - | - | - | - | - | - | - | - | - | - | 48.8% | 38.2% | 78.2% |
Plus/minus sample — 2025-2026: 41 games, 1526.0 minutes, 3224.6 possessions. Other models may cover a different set of games.
Advanced Stats
Legacy model artifacts; separate from the counting cohort. Model output season: 2025-2026. Plus/minus scope: 41 games.
| RAPM | Rank | Minutes | Possessions | Model PM | Model PM/G | Model PM/40 |
|---|---|---|---|---|---|---|
| +0.81 | 131 | 1526 | 3072 | +323 | +7.9 | +8.5 |
RAPM = Regularized Adjusted Plus-Minus (points per 100 possessions above average)
Model Outputs — 2025-2026
CatalogOutput is shown as model rating with league rank in parentheses when available.
| Model | Output | Notes |
|---|---|---|
| RAPM Overall RAPM Overall Single-parameter regularized adjusted plus-minus estimate. More → | +0.81 (#131) | SE 1.83 | Poss 3072 |
| RAPM Off/Def RAPM Off/Def Simultaneous offensive and defensive RAPM decomposition. More → | +0.81 (#131) | Off -0.48 | Def +1.30 |
| Plus/Minus Rate Plus/Minus Rate Raw plus/minus rate baseline per 100 possessions. More → | +10.02 (#32) | PM/G +7.9 | PM/40 +8.5 |
| Plus/Minus Rate Recency Plus/Minus Rate Recency Recency-weighted raw plus/minus rate baseline. More → | +1.90 (#196) | PM/G +7.9 | PM/40 +8.5 |
| Points For Elo Points For Elo Online player rating for contribution to team scoring rate. More → | +0.95 (#82) | Pts For +0.95 | Prevent +2.14 | Net +3.09 | Min 1454 |
| Points Prevention Elo Points Prevention Elo Online player rating for suppressing the opponent's scoring rate. More → | +2.14 (#28) | Pts For +0.95 | Prevent +2.14 | Net +3.09 | Min 1454 |
| Points Net Elo Points Net Elo Net point-differential event Elo from points created plus points prevented. More → | +3.09 (#35) | Pts For +0.95 | Prevent +2.14 | Net +3.09 | Min 1454 |
| Rebounds For Elo Rebounds For Elo superseded Online player rating for contribution to team rebound rate. More → | +0.13 (#169) | Reb For +0.13 | Prevent -0.85 | Net -0.72 | Min 1454 |
| Rebound Prevention Elo Rebound Prevention Elo superseded Online player rating for suppressing the opponent's rebound rate. More → | -0.85 (#513) | Reb For +0.13 | Prevent -0.85 | Net -0.72 | Min 1454 |
| Offensive Rebounds For Elo Offensive Rebounds For Elo superseded Online player rating for contribution to own-team offensive rebounds. More → | -0.42 (#468) | OReb For -0.42 | Prevent -0.35 | Net -0.76 | Min 1454 |
| Offensive Rebound Prevention Elo Offensive Rebound Prevention Elo superseded Online player rating for preventing opponent offensive rebounds. More → | -0.35 (#502) | OReb For -0.42 | Prevent -0.35 | Net -0.76 | Min 1454 |
| Offensive Rebound Net Elo Offensive Rebound Net Elo superseded Net offensive-rebound event Elo from second chances created plus denied. More → | -0.76 (#500) | OReb For -0.42 | Prevent -0.35 | Net -0.76 | Min 1454 |
| Defensive Rebounds For Elo Defensive Rebounds For Elo superseded Online player rating for contribution to own-team defensive rebounds. More → | +0.54 (#65) | DReb For +0.54 | Prevent -0.50 | Net +0.04 | Min 1454 |
| Defensive Rebound Prevention Elo Defensive Rebound Prevention Elo superseded Online player rating for suppressing opponent defensive rebounds. More → | -0.50 (#491) | DReb For +0.54 | Prevent -0.50 | Net +0.04 | Min 1454 |
| Defensive Rebound Net Elo Defensive Rebound Net Elo superseded Net defensive-rebound event Elo from defensive boards created plus denied. More → | +0.04 (#212) | DReb For +0.54 | Prevent -0.50 | Net +0.04 | Min 1454 |
| Rebound Margin Elo Rebound Margin Elo superseded Net rebound-margin event Elo from rebounds created plus rebounds prevented. More → | -0.72 (#421) | Reb For +0.13 | Prevent -0.85 | Net -0.72 | Min 1454 |
| Assists For Elo Assists For Elo Online player rating for contribution to team assist rate. More → | -0.09 (#319) | Ast For -0.09 | Prevent +0.40 | Net +0.31 | Min 1454 |
| Assist Prevention Elo Assist Prevention Elo Online player rating for suppressing the opponent's assist rate. More → | +0.40 (#87) | Ast For -0.09 | Prevent +0.40 | Net +0.31 | Min 1454 |
| Assists Net Elo Assists Net Elo Net assist event Elo from assisted creation plus assisted-shot prevention. More → | +0.31 (#150) | Ast For -0.09 | Prevent +0.40 | Net +0.31 | Min 1454 |
| Threes For Elo Threes For Elo Online player rating for contribution to team made-threes rate. More → | +0.43 (#79) | 3PM For +0.43 | Prevent -0.27 | Net +0.16 | Min 1454 |
| Three Prevention Elo Three Prevention Elo Online player rating for suppressing the opponent's made-threes rate. More → | -0.27 (#470) | 3PM For +0.43 | Prevent -0.27 | Net +0.16 | Min 1454 |
| Threes Net Elo Threes Net Elo Net made-three event Elo from threes created plus threes prevented. More → | +0.16 (#160) | 3PM For +0.43 | Prevent -0.27 | Net +0.16 | Min 1454 |
| Stocks For Elo Stocks For Elo Online player rating for contribution to team steals-plus-blocks rate. More → | +0.54 (#37) | Stocks For +0.54 | Prevent +0.22 | Net +0.76 | Min 1454 |
| Stocks Prevention Elo Stocks Prevention Elo Online player rating for suppressing opponent stocks. More → | +0.22 (#101) | Stocks For +0.54 | Prevent +0.22 | Net +0.76 | Min 1454 |
| Stocks Net Elo Stocks Net Elo Net stocks event Elo from stocks created plus stocks denied. More → | +0.76 (#36) | Stocks For +0.54 | Prevent +0.22 | Net +0.76 | Min 1454 |
| Ball Security Elo Ball Security Elo Online player rating for keeping own-team turnovers down. More → | +0.50 (#42) | TOV For +0.50 | Prevent +0.54 | Net +1.03 | Min 1454 |
| Turnover Force Elo Turnover Force Elo Online player rating for forcing opponent turnovers. More → | +0.54 (#47) | TOV For +0.50 | Prevent +0.54 | Net +1.03 | Min 1454 |
| Turnover Margin Elo Turnover Margin Elo Net turnover event Elo from ball security plus turnover force. More → | +1.03 (#17) | TOV For +0.50 | Prevent +0.54 | Net +1.03 | Min 1454 |
Shot Chart — 2026-2027
23/43 FG (53.5%), 58 points from the field · NBA Stats shot locations · compared with the 2025-2026 league average (latest season on file)
| Zone | FGM | FGA | FG% | League FG% | +/- | % of FGA |
|---|---|---|---|---|---|---|
| Restricted area | 5 | 5 | 100.0 | 66.8 | +33.2 | 11.6 |
| Paint (non-RA) | 5 | 10 | 50.0 | 44.7 | +5.3 | 23.3 |
| Mid-range left | 1 | 3 | 33.3 | 40.8 | -7.5 | 7.0 |
| Mid-range center | 0 | 0 | - | 42.1 | - | 0.0 |
| Mid-range right | 0 | 0 | - | 42.2 | - | 0.0 |
| Left corner 3 | 2 | 5 | 40.0 | 38.1 | +1.9 | 11.6 |
| Right corner 3 | 2 | 2 | 100.0 | 38.6 | +61.4 | 4.7 |
| Above-break 3 left | 4 | 12 | 33.3 | 35.7 | -2.4 | 27.9 |
| Above-break 3 center | 1 | 2 | 50.0 | 35.2 | +14.8 | 4.7 |
| Above-break 3 right | 3 | 4 | 75.0 | 34.4 | +40.6 | 9.3 |
Career Stats
STATSNBA · NBA · regular-season appearances. Coverage reflects stored source games. Participation unresolved for 67 of 410 source rows; GP and per-game averages are unknown. Unresolved zero/NULL lines are not classified as DNP. Other career leagues are available through the league links above.
| Season | League | Team | GP | MIN | PTS | REB | AST | STL | BLK | TO | FGA | Numbers | FG% | 3P% | FT% | TS% | eFG% |
|---|---|---|---|---|---|---|---|---|---|---|---|---|---|---|---|---|---|
| 2026-2027 | NBA | Atlanta Hawks | 4 | 27.1 | 15.8 | 3.2 | 1.5 | 1.5 | 0.2 | 0.8 | 10.8 | 10.8 | 53.5% | 48.0% | 71.4% | 68.4 | 67.4 |
| 2025-2026 | NBA | Oklahoma City Thunder | - | - | - | - | - | - | - | - | - | - | 43.1% | 35.6% | 73.6% | 53.8 | 52.1 |
| 2024-2025 | NBA | Oklahoma City Thunder | - | - | - | - | - | - | - | - | - | - | 48.8% | 38.3% | 83.1% | 59.6 | 57.7 |
| 2023-2024 | NBA | Oklahoma City Thunder | - | - | - | - | - | - | - | - | - | - | 56.2% | 49.2% | 78.9% | 66.4 | 64.5 |
| 2022-2023 | NBA | Oklahoma City Thunder | - | - | - | - | - | - | - | - | - | - | 51.2% | 39.3% | 83.1% | 60.7 | 57.9 |
| 2021-2022 | NBA | Oklahoma City Thunder | - | - | - | - | - | - | - | - | - | - | 46.3% | 30.4% | 72.9% | 55.6 | 52.5 |
Advanced: Numbers = PTS+REB+AST+STL+BLK-TO-FGA, TS% = True Shooting, eFG% = Effective FG
Game Log — 2026-2027
STATSNBA · NBA · regular-season appearances. Coverage reflects stored source games. Participation unresolved for 67 of 410 source rows; GP and per-game averages are unknown. Unresolved zero/NULL lines are not classified as DNP.
The latest season's 4 of 410 career games; each season's games are under its link above.