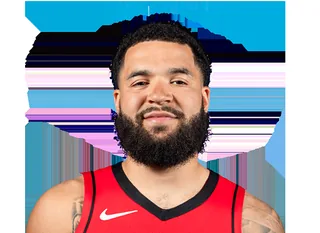
Fred VanVleet
Team: Toronto Raptors
Position: G
Career Stats Across Linked Profiles
Season observations across linked profiles for F. VanVleet. Per-game averages from the source shown; select a season to view its profile.
ESPN season totals include all teams and completed recorded phases, including special games; these are not regular-season totals. Team splits are shown on the linked profile.
| Season | League | Team | Source | GP | MIN | PTS | REB | AST |
|---|---|---|---|---|---|---|---|---|
| 2025-2026 | NBA | Houston Rockets | NBA Stats | - | - | - | - | - |
| 2024-2025 | NBA | Houston Rockets | NBA Stats | - | - | - | - | - |
| 2023-2024 | NBA | Houston Rockets | NBA Stats | - | - | - | - | - |
| 2022-2023 | NBA | Toronto Raptors | NBA Stats | - | - | - | - | - |
| 2021-2022 | NBA | Toronto Raptors | NBA Stats | - | - | - | - | - |
| 2020-2021 | NBA | Toronto Raptors | NBA Stats | - | - | - | - | - |
| 2019-2020 | NBA | Toronto Raptors | NBA Stats | - | - | - | - | - |
| 2017-2018 | NBA | Toronto Raptors | NBA Stats | 9 | 20.6 | 10.1 | 1.8 | 3.2 |
| 2016-2017 | NBA | Toronto Raptors | NBA Stats | 1 | 20.6 | 5.0 | 4.0 | 6.0 |
| 2016-2017 | GLEAGUE | Raptors 905 | NBA Stats | 16 | 32.4 | 16.9 | 3.4 | 7.6 |
| 2015-2016 | NCAAM | Wichita State Shockers | ESPN | 13 | 29.9 | 11.9 | 3.0 | 4.8 |
| 2014-2015 | NCAAM | Wichita State Shockers | ESPN | 31 | 31.2 | 13.8 | 4.5 | 5.2 |
| 2013-2014 | NCAAM | Wichita State Shockers | ESPN | 29 | 32.0 | 11.3 | 4.2 | 5.3 |
| 2012-2013 | NCAAM | Wichita State Shockers | ESPN | 39 | 16.2 | 4.3 | 1.8 | 2.3 |
Season Averages — 2017-2018
Observed regular-season final played games
Season totals are unavailable while 32 game records need confirmation. Confirmed appearances: 9.
| GP | MPG | PPG | RPG | APG | SPG | BPG | TO | FGA | Numbers | +/- PG | +/- Tot | +/- /40 | FG% | 3P% | FT% |
|---|---|---|---|---|---|---|---|---|---|---|---|---|---|---|---|
| - | - | - | - | - | - | - | - | - | - | - | - | - | - | - | - |
Model Outputs
No verified model outputs are published for this player in NBA yet.
Shot Chart — 2017-2018
147/330 FG (44.5%), 372 points from the field · NBA Stats shot locations · compared with the 2017-2018 league average
| Zone | FGM | FGA | FG% | League FG% | +/- | % of FGA |
|---|---|---|---|---|---|---|
| Restricted area | 61 | 117 | 52.1 | 63.2 | -11.1 | 35.5 |
| Paint (non-RA) | 6 | 27 | 22.2 | 39.9 | -17.7 | 8.2 |
| Mid-range left | 2 | 6 | 33.3 | 39.8 | -6.5 | 1.8 |
| Mid-range center | 0 | 3 | 0.0 | 42.5 | -42.5 | 0.9 |
| Mid-range right | 0 | 2 | 0.0 | 40.2 | -40.2 | 0.6 |
| Left corner 3 | 15 | 33 | 45.5 | 38.1 | +7.4 | 10.0 |
| Right corner 3 | 10 | 21 | 47.6 | 40.4 | +7.2 | 6.4 |
| Above-break 3 left | 25 | 48 | 52.1 | 35.1 | +17.0 | 14.5 |
| Above-break 3 center | 12 | 28 | 42.9 | 35.8 | +7.1 | 8.5 |
| Above-break 3 right | 16 | 41 | 39.0 | 35.6 | +3.4 | 12.4 |
| Backcourt | 0 | 4 | 0.0 | 0.7 | -0.7 | 1.2 |
Career Stats
STATSNBA · NBA · regular-season appearances. Coverage reflects stored source games. Other career leagues are available through the league links above.
| Season | League | Team | GP | MIN | PTS | REB | AST | STL | BLK | TO | FGA | Numbers | FG% | 3P% | FT% | TS% | eFG% |
|---|---|---|---|---|---|---|---|---|---|---|---|---|---|---|---|---|---|
| 2025-2026 | NBA | Houston Rockets | - | - | - | - | - | - | - | - | - | - | - | - | - | - | - |
| 2024-2025 | NBA | Houston Rockets | - | - | - | - | - | - | - | - | - | - | 37.8% | 34.5% | 81.6% | 51.5 | 48.3 |
| 2023-2024 | NBA | Houston Rockets | - | - | - | - | - | - | - | - | - | - | 41.6% | 38.7% | 86.0% | 56.8 | 52.7 |
| 2022-2023 | NBA | Toronto Raptors | - | - | - | - | - | - | - | - | - | - | 39.3% | 34.2% | 89.8% | 54.0 | 48.6 |
| 2021-2022 | NBA | Toronto Raptors | - | - | - | - | - | - | - | - | - | - | 40.3% | 37.7% | 87.4% | 55.2 | 51.3 |
| 2020-2021 | NBA | Toronto Raptors | - | - | - | - | - | - | - | - | - | - | 38.9% | 36.6% | 88.5% | 53.4 | 48.9 |
| 2019-2020 | NBA | Toronto Raptors | - | - | - | - | - | - | - | - | - | - | 41.3% | 39.0% | 84.8% | 55.3 | 50.7 |
| 2017-2018 | NBA | Toronto Raptors | 9 | 20.6 | 10.1 | 1.8 | 3.2 | 0.4 | 0.2 | 0.8 | 7.6 | 7.4 | 47.1% | 51.3% | 63.6% | 62.5 | 61.8 |
| 2016-2017 | NBA | Toronto Raptors | 1 | 20.6 | 5.0 | 4.0 | 6.0 | 0.0 | 0.0 | 0.0 | 7.0 | 8.0 | 28.6% | 0.0% | 50.0% | 31.7 | 28.6 |
Advanced: Numbers = PTS+REB+AST+STL+BLK-TO-FGA, TS% = True Shooting, eFG% = Effective FG
Game Log
STATSNBA · NBA · regular-season appearances. Coverage reflects stored source games.
| Date | Vs/At | Opponent | Result | Score | MIN | FG | 3PT | FT | REB | AST | STL | BLK | TO | PTS | Numbers | RAPM GS |
|---|---|---|---|---|---|---|---|---|---|---|---|---|---|---|---|---|
| 2018-04-11 | @ | MIA | L | 109-116 | 18 | 2-6 | 1-2 | 2-3 | 1 | 3 | 0 | 0 | 2 | 7 | 3.0 | - |
| 2018-04-08 | vs | ORL | W | 112-101 | 8 | 0-1 | 0-1 | 0-0 | 0 | 3 | 0 | 1 | 2 | 0 | 1.0 | - |
| 2018-04-06 | vs | IND | W | 92-73 | 14 | 1-5 | 0-3 | 0-0 | 2 | 3 | 1 | 0 | 1 | 2 | 2.0 | - |
| 2018-04-04 | vs | BOS | W | 96-78 | 23 | 5-10 | 3-6 | 2-2 | 3 | 4 | 0 | 0 | 0 | 15 | 12.0 | - |
| 2018-04-03 | @ | CLE | L | 106-112 | 22 | 3-10 | 3-5 | 0-0 | 2 | 6 | 1 | 0 | 0 | 9 | 8.0 | - |
| 2018-03-31 | @ | BOS | L | 99-110 | 17 | 4-8 | 2-5 | 1-1 | 1 | 3 | 0 | 0 | 1 | 11 | 6.0 | - |
| 2018-03-27 | vs | DEN | W | 114-110 | 24 | 5-7 | 3-4 | 2-3 | 1 | 4 | 1 | 0 | 0 | 15 | 14.0 | - |
| 2018-03-25 | vs | LAC | L | 106-117 | 22 | 6-9 | 4-6 | 0-0 | 0 | 2 | 0 | 0 | 1 | 16 | 8.0 | - |
| 2018-03-23 | vs | BKN | W | 116-112 | 32 | 6-12 | 4-7 | 0-2 | 6 | 1 | 1 | 1 | 0 | 16 | 13.0 | - |